
Figures & data
Figure 1. Location and geologic overview of the southern Apennines (modified from CitationGioia & Schiattarella, 2006). Red line shows the border of the study area.
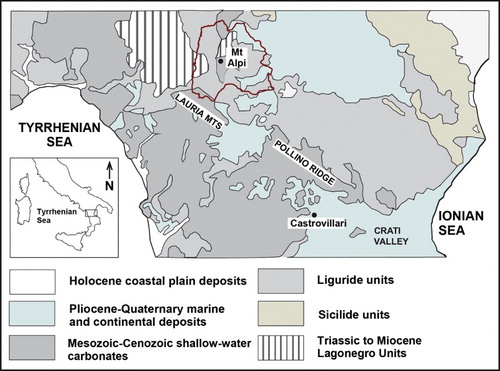
Figure 2. (A) Sketch of the landslide inventory map. Landslides are classified according to their relative age. (B) Box plot comparison for landslide areas within the ‘Very old’, ‘Old’, and ‘2009 landslide event’ classes. Color coding of the box plots is the same as the sketch map in (A). Box plot of the entire inventory is shown for reference.
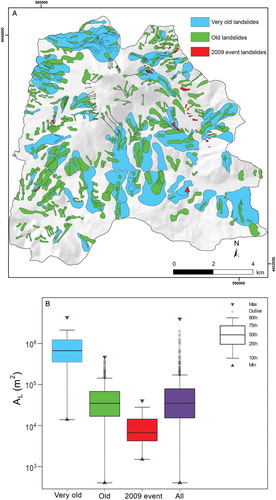
Table 1. Descriptive statistics for landslides mapped on inventory map prepared for the upper Sinni River valley.
Figure 3. Histograms showing the percentage of area covered by landslide-free area (black bars) and landslides (gray bars) within each slope (A) and elevation (B) class.
Supplemental material