Figures & data
Figure 1. Elevation and meteorological stations available for precipitation and temperature in Bolivia (circles: selected stations; triangles: discarded stations).
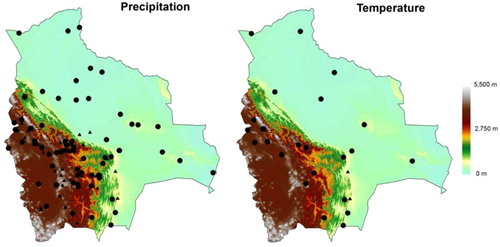
Figure 2. Empirical cumulative distribution functions (ecdfs) for the distance to the Atlantic and Pacific Oceans, Elevation, Latitude and Longitude corresponding to the location of the precipitation (circles) and temperature (triangles) observatories. Solid lines represent the ecdfs from 1 km gridded data sets for the entire Bolivia.
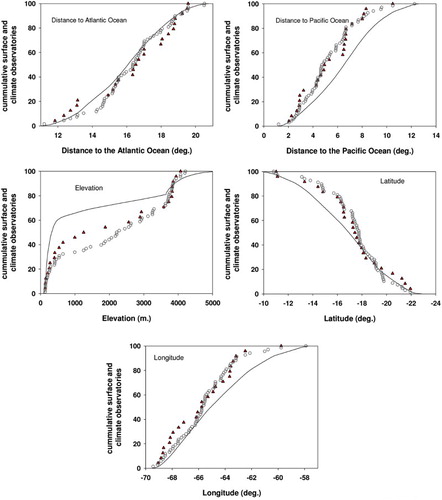
Table 1. Results of the monthly models to map precipitation, and maximum and minimum temperatures.
Figure 3. Spatial distribution of monthly maximum temperature (°C) obtained from regression-based modeling and local interpolation of residuals.
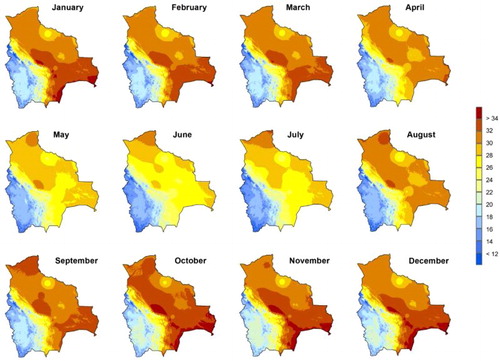
Figure 4. Spatial distribution of monthly minimum temperature (°C) obtained from regression-based modeling and local interpolation of residuals.
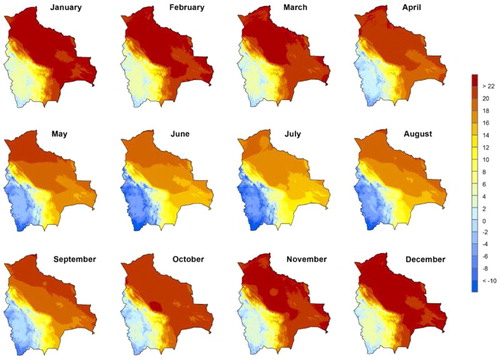
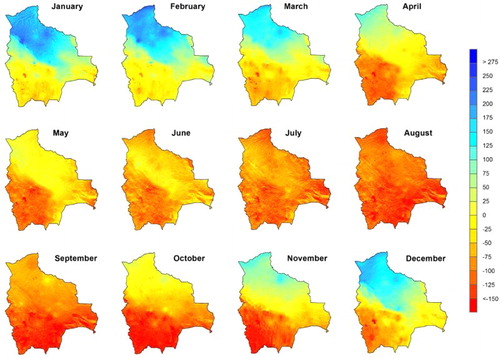
Figure 5. Spatial distribution of monthly precipitation (mm) obtained from regression-based modeling and local interpolation of residuals.
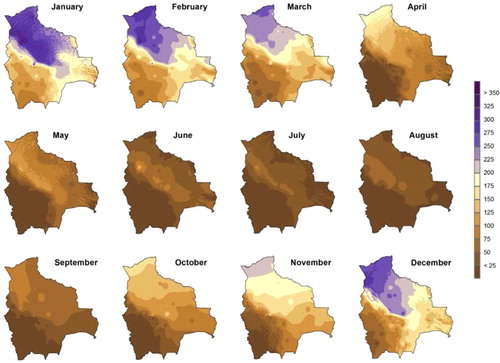
Figure 6. Relationship between observed and predicted monthly precipitation and temperature using the jackknife approach.
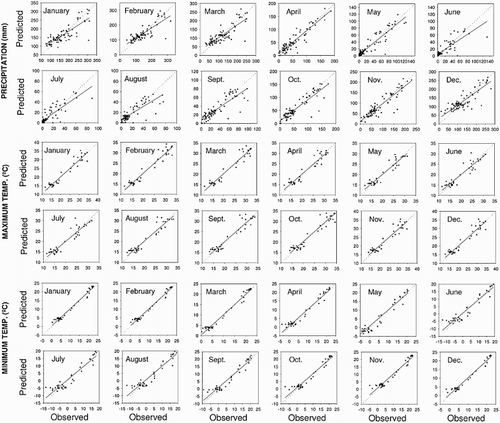
Table 2. Error/accuracy statistics for the monthly precipitation and temperature maps.
Figure 7. Spatial distribution of monthly ETo (mm) obtained from maximum and minimum temperatures and the relief-based modeled solar radiation.
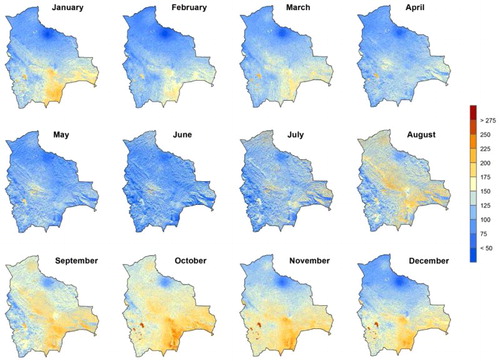
Figure 8. Spatial distribution of monthly climatic water balance (mm) by means of the difference between precipitation and ETo.