Figures & data
Table 1. Geotechnical and hydrological parameters used for the calibration of the SINMAP model.
Figure 1. Four examples of different landslide typologies surveyed in the study area: (a) translational slide located on the left side of the Racanello river; (b) shallow landslide area with some recent reactivations in the Missanello territory; (c) earth-flow on the left side of Sauro river; (d) inactive rotational landslide along the left side of Agri river, featured by a well-marked concave slope profile.
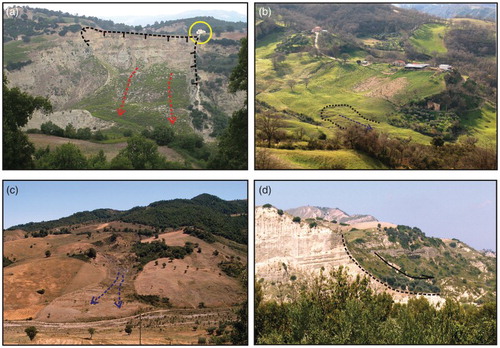
Figure 2. Statistical parameters of the area of each landslide. (a) Box-plot of the landslide area for the different landslide types. (b) Box-plot showing the landslide area for different ages.
Figure 3. Statistical distribution of mean slope values for landslide area. (a) Box-plot showing the comparison of the statistical distribution of the mean slope values for each landslide of different types. (b) Cumulative landslide area for different slope classes.
Figure 4. A detailed view of the landslide susceptibility map from the eastern sector of the study area and its relationships with mapped landslides.
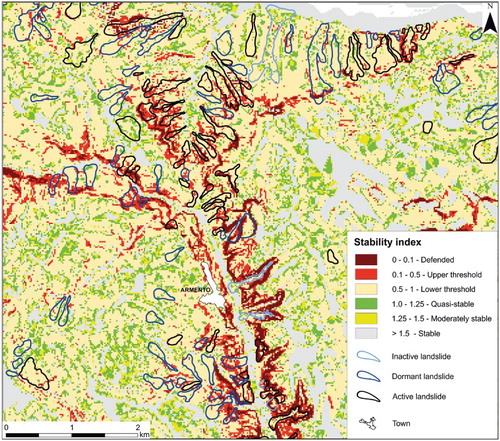
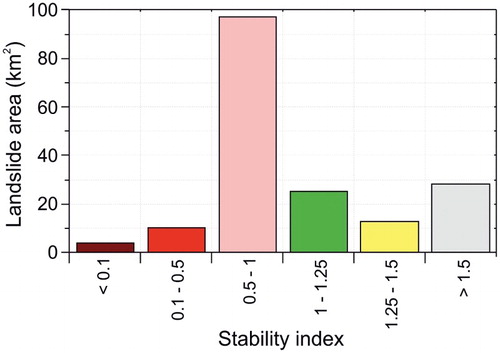
Figure 5. Histogram showing the cumulative landslide area for each class of the SI value. Note that 63% of the total landslide area have a value of SI less than 1 (corresponding to the upper limit of the medium class of landslide susceptibility).