Figures & data
Figure 1. Location of the two municipalities studied and main irrigation elements in the area.
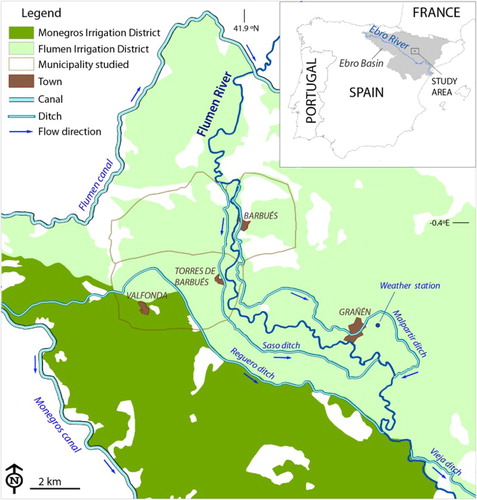
Figure 2. Geomorphic units mapped in the study area with the soil profiles used for defining Soil Series, and the auger sampling sites for the specific soil salinity survey.
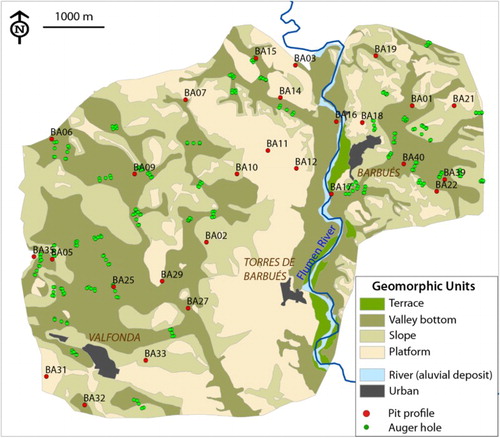
Table 1. Characteristics of the main geomorphic units of the study area.
Figure 3. (a) LiDAR-derived DTM of the study area. (b) The elevation of the four geomorphic units, medians and their confidence interval (in red), interquartile range boxes, means and their line connection. (c) A–B cross profile with the main geomorphic units labeled. (color online)
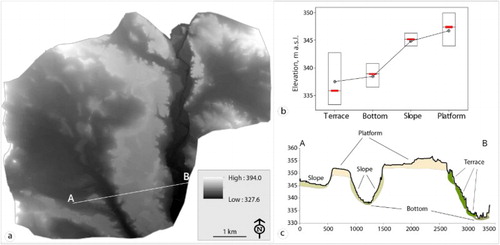
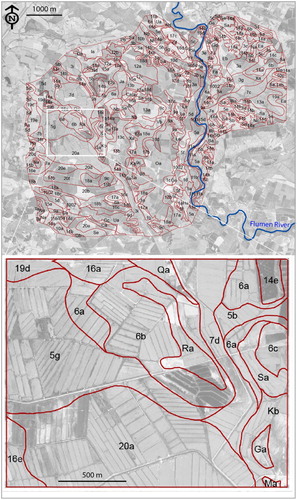
Figure 4. Soil map of Barbués and Torres de Barbués and an enlarged sample area. The scale of the map allows identification of individual plots and the soil attributed to them. The labels in the sample area are explained in .