Figures & data
Figure 1. HazMatMapper in action: (a) central map; (b) configuration controls; (c) advanced context controls; and (d) information panel.
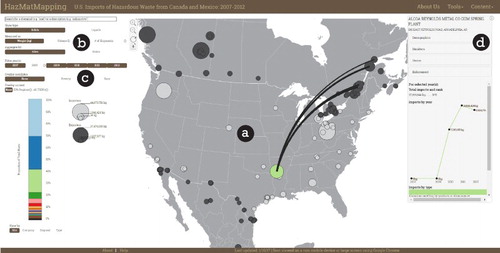
Figure 2. Sample RCRA manifest. Information coded into the spatial database is highlighted. Personal information is screened.
Table 1. Uncertainties in the hazardous waste dataset.
Figure 3. EPA regions.
Figure 4. Using HazMatMapper through the four different interface controls: (a) proportional symbols of waste sites are the default view on the central map; (b) clicking on a site draws flow lines between exporters and importers; (c) accessing the configuration controls allows users to draw choropleths of waste imports binned by state; (d) users overlay poverty statistics through the advanced context controls; (e) clicking on a site retrieves further EJ-relevant site data in an information panel; (f) selecting ‘manifests’ in the informational panel lets the user download copies of the site’s waste trade forms.
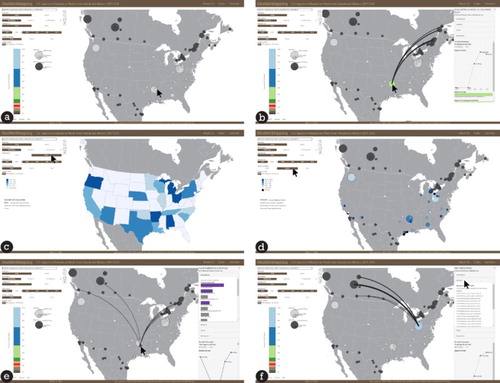
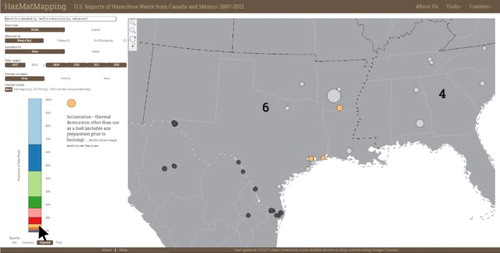
Figure 5. Users can filter the map, shading it by waste processing types. Investigating the kinds of waste disposal methods for EPA Region 6, the user might first shade the map by the sites planning to process waste under the code ‘H040,’ which indicates ‘Incineration’.