
Figures & data
Figure 1. Tectono-metamorphic sketch map of the Variscan basement in Sardinia (after CitationFunedda et al., 2015).
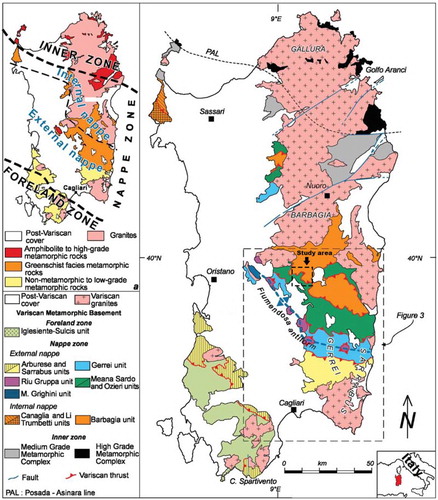
Figure 2. Schematic structural map of the Variscan basement of SE Sardinia (after CitationFunedda et al., 2015).
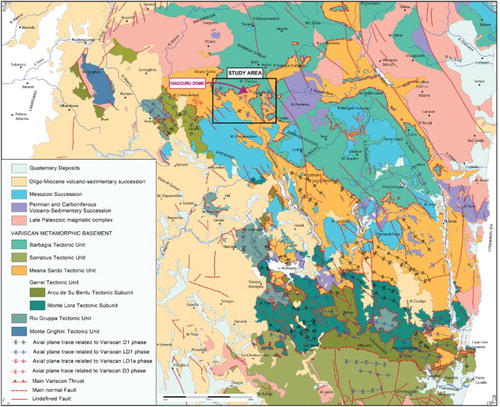
Figure 3. Stratigraphic logs of the Barbagia and Meana Sardo units in the study area and related spectrometric features. Formation acronyms as reported in the Main Map.
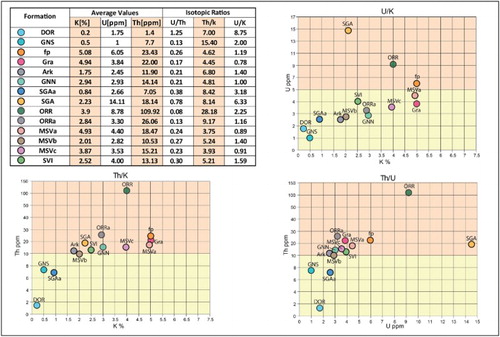
Figure 4. Isotopic characteristics of Paleozoic terrigenous lithologies in the Gadoni area. Formation acronyms as reported in the Main Map.
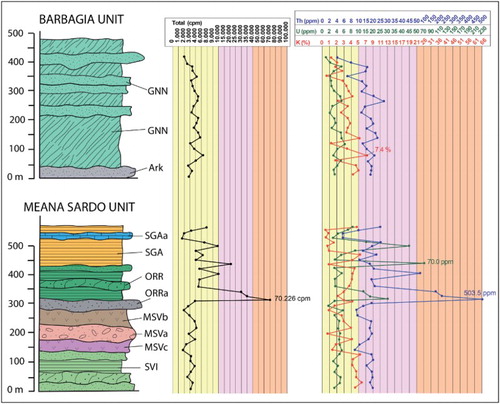
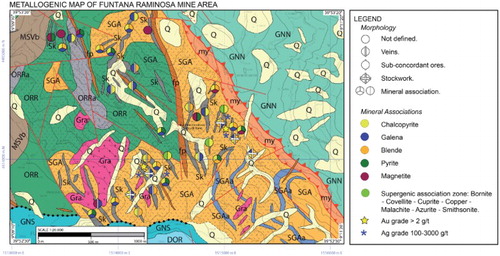
Figure 5. Ore deposit sketch map of the Gadoni area.
Supplemental material