
Figures & data
Figure 1. Scheme showing the relations between the geologic features and geologic concepts used for the construction of the Map Legend. Concepts and features (represented by plain text labels) are grouped in distinct ontologies or vocabularies (represented by coloured triangles). See ‘WikiGeo’ (https://www.di.unito.it/wikigeo/index.php?title=Pagina_principale) for further details.
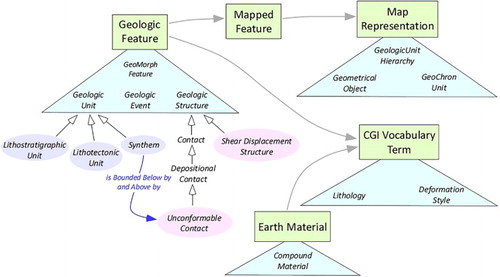
Table 1. List of the encoded Geologic Events, identified back to late Carboniferous times, which the Geologic Units and Geologic Structures of the Map have been referred to, in order to make correlations at regional scale.
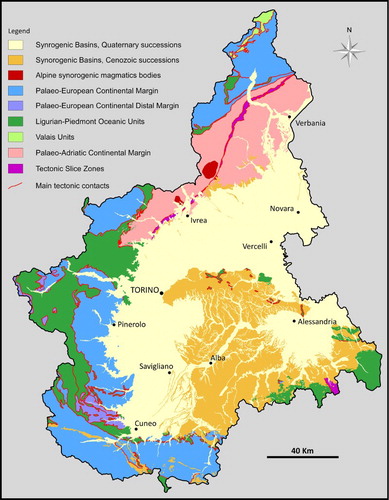
Figure 2. Scheme showing the present distribution of the palaeogeographic and physiographic domains, as well as the geologic units belonging to the other main categories adopted to construct the Map Legend.
Supplemental material