Figures & data
Figure 1. List of storm events with documented floods that occurred between 2001 and 2014 in the city of Rome. The maximum rainfall intensity in 1, 3, 24 and 72 hours is reported. The number of observed floods considerably rose from 2008, independently of the storm intensity, due to the increased availability of data, mainly acquired from web media.
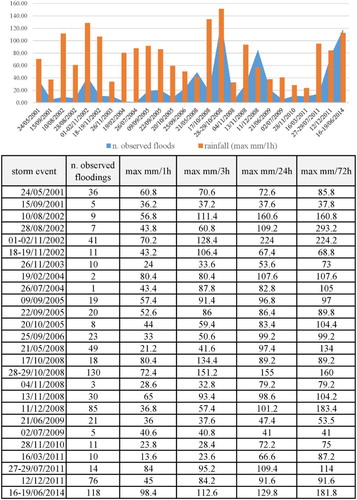
Figure 2. Flowchart describing the susceptibility analysis and impact assessment used for the hazard map development.
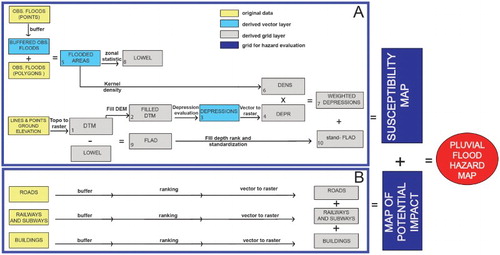
Figure 3. Examples of grid and vector layers produced for the flood hazard mapping. (a) density of observed floods (DENS grid); (b) FILLED DTM and weighted depressions (WEIGHTED DEPRESSION grid); (c) Standardized fill depth of flooded areas (stand-FLAD grid) and (d) Resulting map of susceptibility to pluvial flood. Geographic coordinates refer to the WGS84 geodetic system.
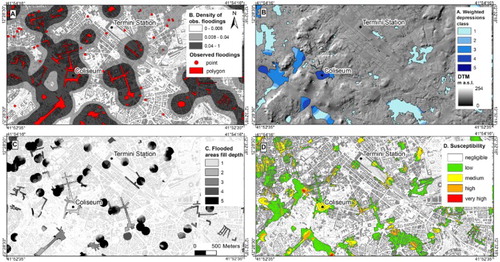
Figure 4. Potential fill depth of a FPA. (a) In common hydraulic models, the flood depth values are computed by subtracting the ground elevation from the water surface elevation for each return period or computed flood scenario. (b) In this work, the potential fill depth of a prone area is calculated instead of flood depth; fill depth is defined as the difference between the ground elevation (DTM) and the lowest elevation of the FPA.
Figure 5. Map of the potential impact. The layers representing impact are clipped by areas susceptible to flood.
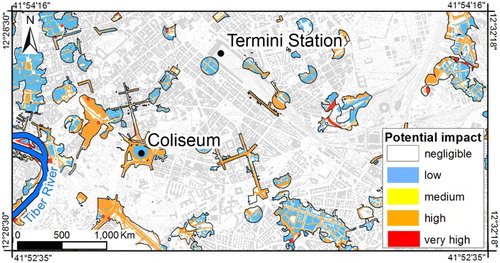
Table 1. Potential impact ranking.
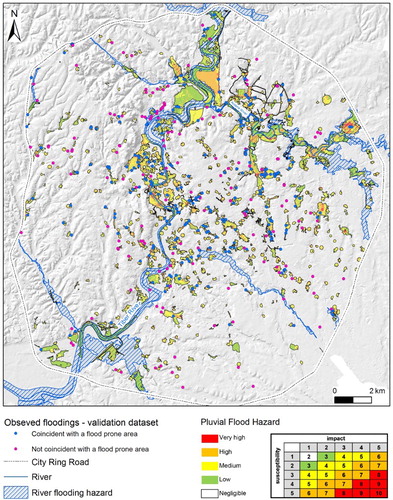
Figure 6. Results of hazard map validation.