
Figures & data
Figure 1. Research area.
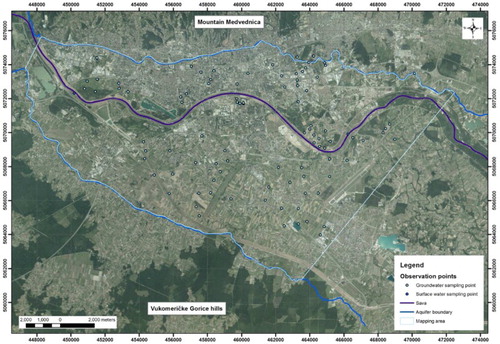
Figure 2. Histogram plots of the measured (input) nitrate concentration distribution showing the initial distribution, distribution after the Box-Cox transformation and after the normal score transformation.
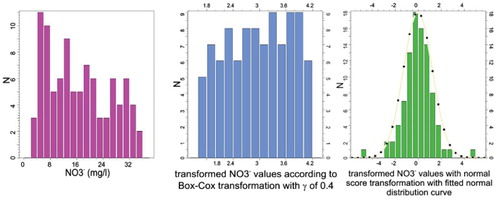
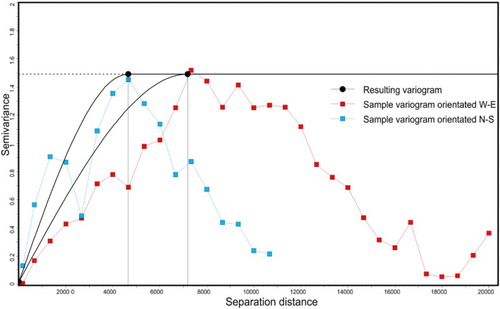
Figure 3. Plotted variance values for construction of anisotropic variogram for GS mapping.
Supplemental material