
Figures & data
Figure 1. Basic structure of database tables in the program MS Access.
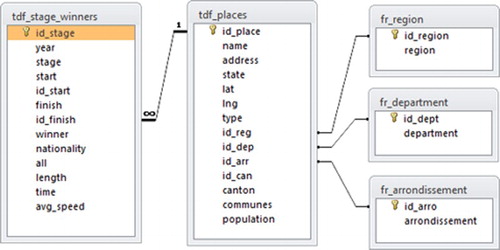
Table 1. Example of a question and the corresponding SQL syntax for displaying the answer.
Figure 2. Representation of finish places of the Tour de France in selected periods.
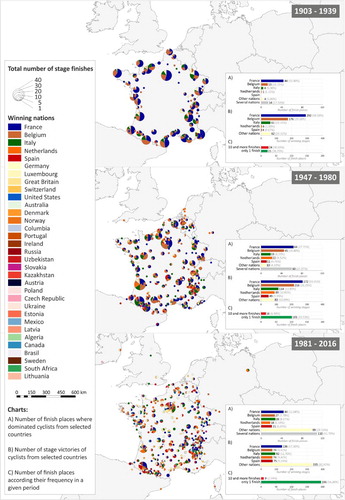
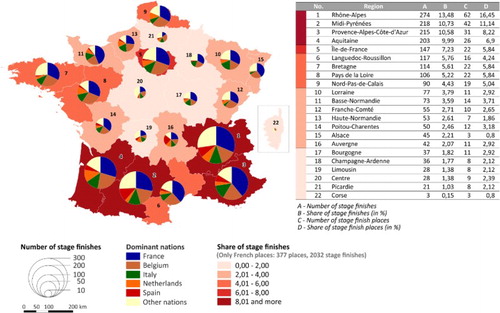
Figure 3. Visits to individual regions of France during the long history of the Tour de France (1903–2016).
Supplemental material