Figures & data
Table 1. Descriptive statistics of the Annual Cosmic-Ray Dose at 1 km resolution.
Figure 1. Effective dose rate (μSv/h) due to cosmic rays estimated using EXPACS model considering different vertical cut-off rigidity (GV) values and using the approach described in the present study as function of altitude (km).
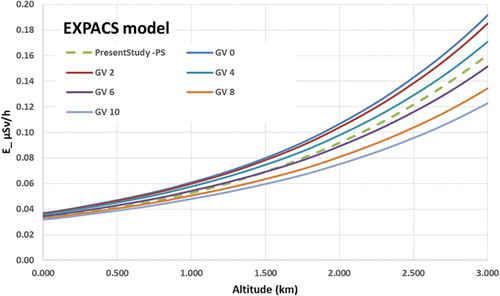
Figure 2. Relative differences between the effective dose rates due to cosmic rays estimated using EXPACS model considering different vertical cut-off rigidity (GV) values and using the approach described in the present study as function of altitude (km).
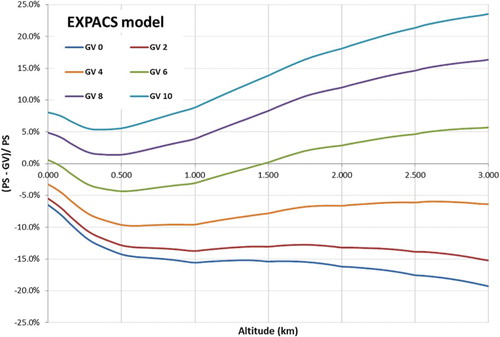
Figure 3. Effective dose rate (μSv/h) due to cosmic rays estimated using CARI-6 model considering different vertical cut-off rigidity (GV) values and using the approach described in the present study as function of altitude (km).
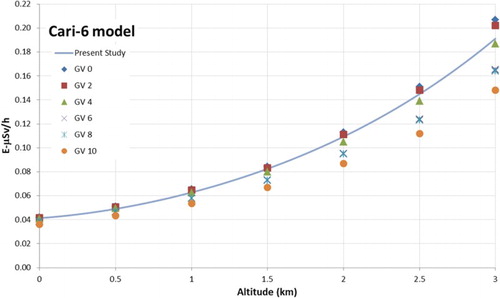
Figure 4. Relative differences between the effective dose rates due to cosmic rays estimated using CARI-6 model considering different vertical cut-off rigidity (GV) values and using the approach described in the present study as function of altitude (km).
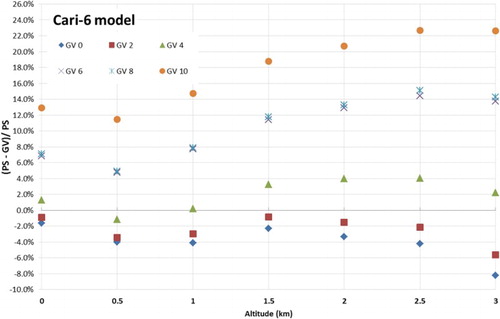
Figure 5. (a) Population density (inhabitants per 1 km × 1 km cell) versus annual cosmic-ray dose (μSv). (b) Histogram reporting fraction of population in annual cosmic-ray dose classes of 25 μSv starting from 300 μSv.
Figure 6. Annual cosmic-ray collective effective dose (mSv*person) and the population-weighted average (per person) annual effective dose (annual dose per capita) due to cosmic rays for each country considered (the ISO country code is quoted for each country; see the supplementary material for the corresponding country name). The countries are in order of population size, from the highest, Germany, to the lowest, Iceland.
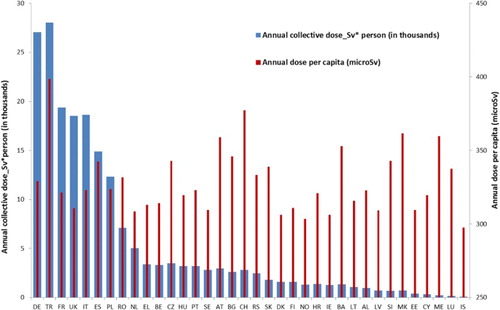
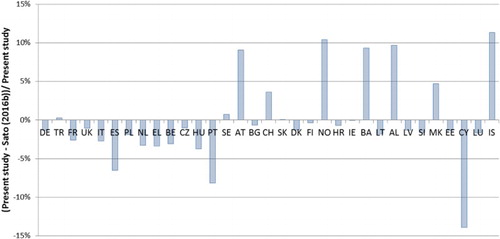
Figure 7. Relative difference (in percentage) between the population-weighted average (per capita) annual cosmic-ray doses estimated in the present work and in CitationSato (2016b) for each country considered.