Figures & data
Figure 1. (a) Geographical setting of the Isonzo/Soča River; (b) Geological map of the Isonzo/Soča High Plain and surroundings (redrawn from CitationBuser, 1968; CitationCarulli, 2006; CitationJurkovšek et al., 2016).
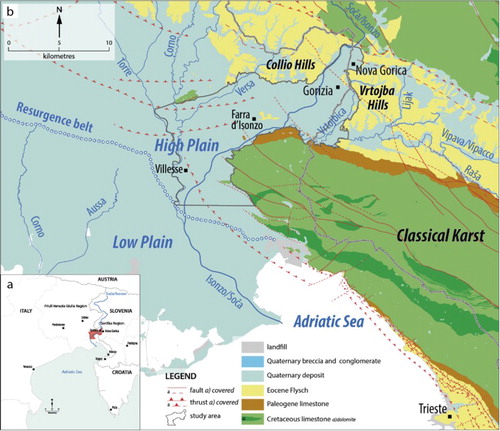
Figure 2. (a) the Isonzo/Soča river in its northern sector, where it flows over carbonate rocks (Kanal ob Soči, GO, SLO); (b) view of the High Plain (San Pier d’Isonzo, GO, ITA); (c,d) the Isonzo/Soča river in the High Plain and water monitoring (Poggio Terza Armata, GO, ITA); (e) pumping test at Turriaco (GO, ITA).
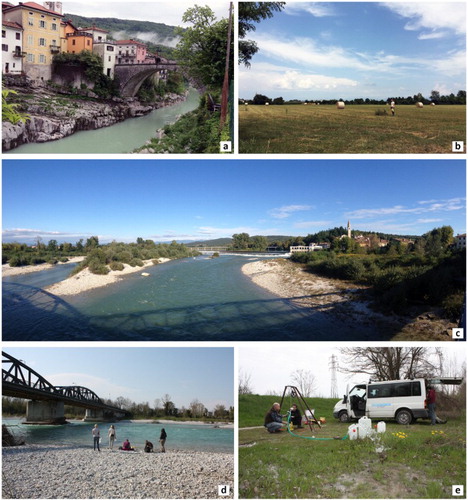
Figure 3. (a,b) Depth to groundwater map and relative ‘S’ scores; (c,d) Effective infiltration map and corresponding ‘I’ ratings; (e,f) Soil textures map and relative ‘T’ values.
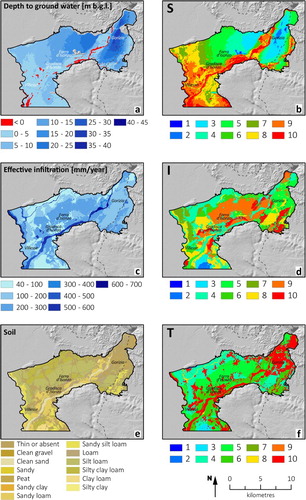
Figure 4. (a) Scores for the attenuation action of the unsaturated zone (N); (b) Ratings related to the aquifer characteristics (A); (c) Scores for the hydraulic conductivity (C); (d) Ratings for the slope ranges (S).
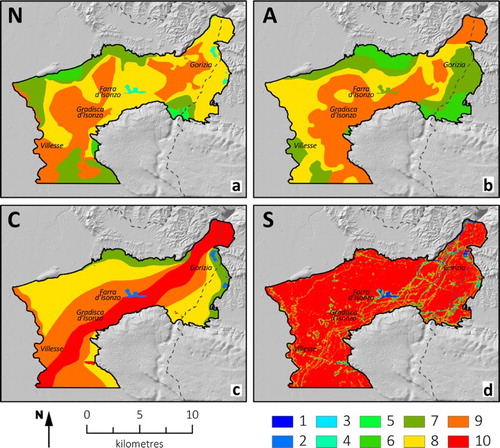
Table 1. Scores of “N” (Unsaturated zone attenuation capacity) and “A” (Hydrogeological characteristics of the aquifer) assigned to the different hydro-lithological levels.
Figure 5. Hydrogeological and impact situations.
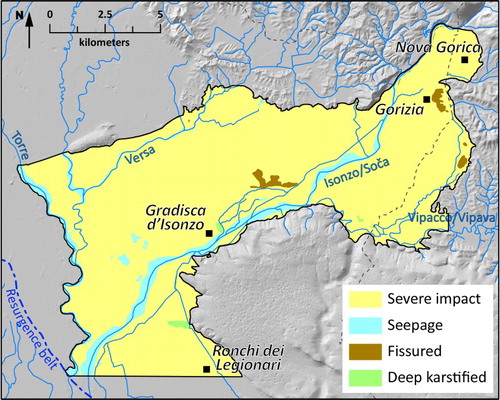
Table 2. Weight strings for the hydrogeological and impact situations identified.
Figure 6. Hazard sources according to CitationCivita and Zavatti (2006).
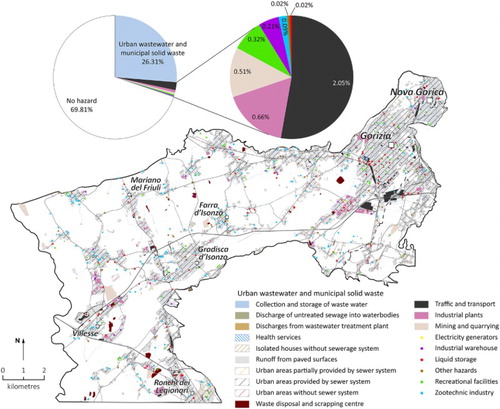
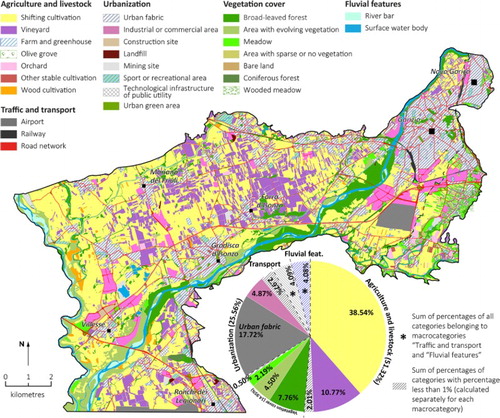
Figure 7. Land use classes according to CitationTrevisan et al. (1998).