Figures & data
Figure 1. Location of southern Calabria (grey rectangle) and Sicily. The red square marks the limits of the study area. The main stream network (cf. blue lines) and toponyms mentioned in the text are also shown. Black triangles mark radar locations at Mt. Pettinascura and Mt. Lauro. Black squares show locations of Aspromonte massif and Serre mountain chain.
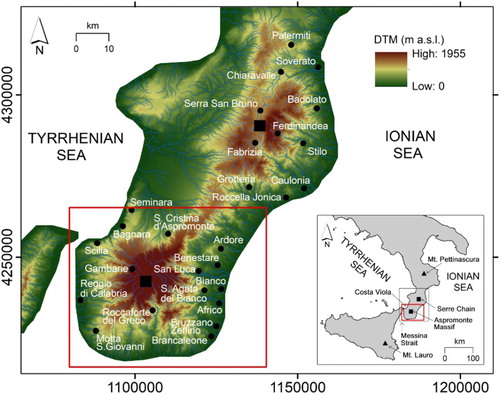
Figure 2. Cumulative frequency (%) of the extent of shallow landslides mobilized by the Autumn 2015 rainfall event in the study area.
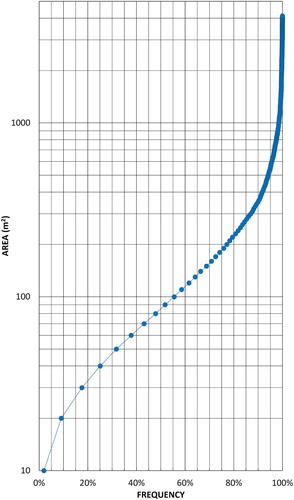
Figure 3. Areal distribution of shallow landslides triggered by the Autumn 2015 event with respect to lithological classes (in grey, ratio of landslide area in a given lithotype to total landslide area, in %), and landslide indices for the same types of outcrops (in blue, ratio of landslide area in a given lithotype to total area of the same lithotype, in %). Key: (a) Alluvium, colluvium and residual soil; (b) Clay and clayey flysch; (c) Sand and silt; (d) Conglomerate and sandstone; (e) Evaporite rock; (f) Flysch; (g) Carbonate rock; (h) Argillite and low-grade metamorphic rock; (i) Igneous and medium-high grade metamorphic rock.
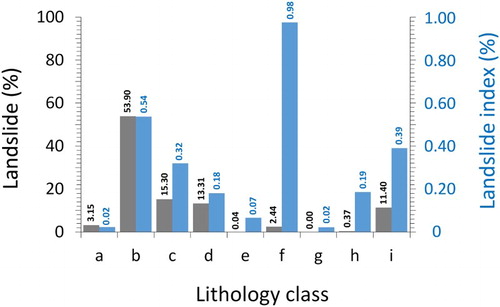
Figure 4. Areal distribution of shallow landslides triggered by the Autumn 2015 event with respect to slope classes (in grey), and landslide indices against the same slope classes (in blue). Values of areal distribution and indices are computed similarly to .
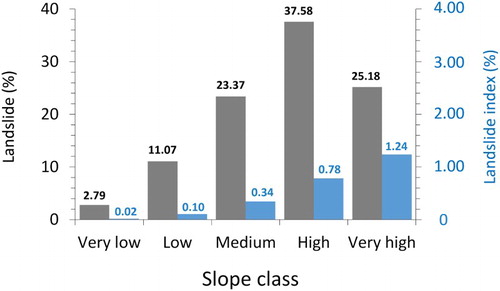
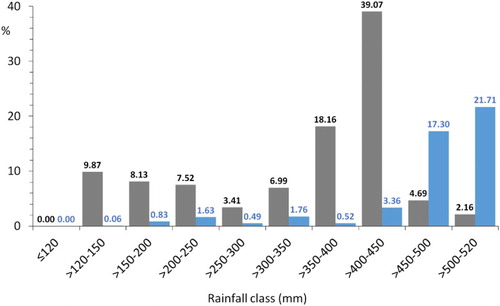
Figure 5. Areal distribution of shallow landslides triggered by the Autumn 2015 event with respect to classes of (in grey), and landslide indices against the same
classes (in blue). Values of areal distribution and indices are computed similarly to .