
Figures & data
Figure 1. Global population density sub-continental scale examples at 1 km cell resolution: Europe (top) and East Asia (bottom).
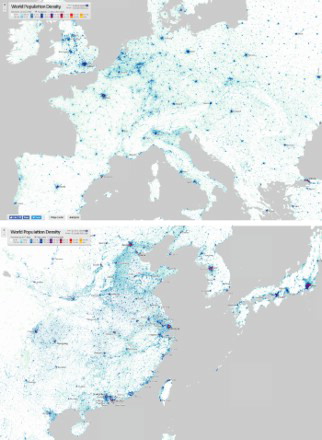
Figure 2. Global population density mega city-region examples at 250 m cell resolution: New York (top) and Shanghai (bottom).
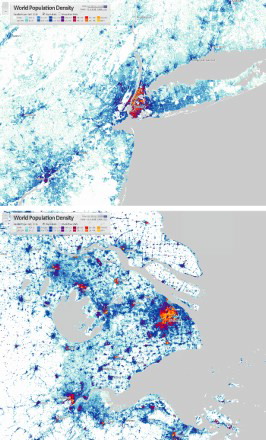
Figure 3. Global population totals by density class (1 km cell resolution).
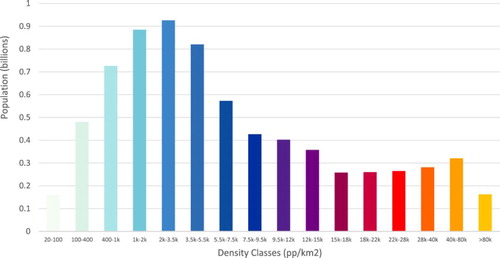
Figure 4. Global land area totals by density class (1 km cell resolution).
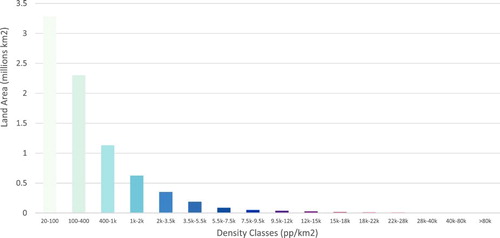
Figure 5. Interactive national statistics examples for USA and India.
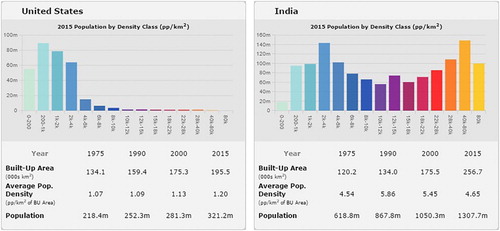
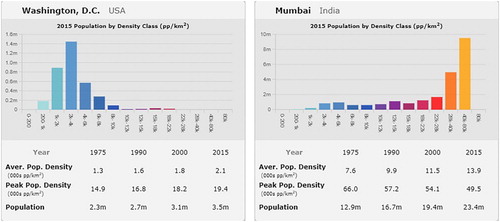
Figure 6. Interactive city statistics examples for Washington, DC and Mumbai.
Supplemental material