Figures & data
Figure 1. Virkisjökull-Falljökull and Svínafellsjökull glaciers, outlets of the Öræfajökull ice cap at the southern extremity of Vatnajökull, with Iceland inset.
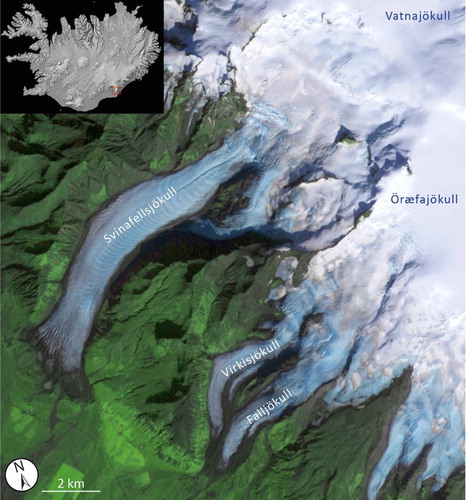
Figure 2. (a) Proglacial area of Virkisjökull-Falljökull, characterised by surface sediments overlying inactive, downwasting buried ice. Fine dashed line indicates boundaries between this buried ice and the more active ice of the glacier margins, and the surrounding moraine-covered slopes. Large dashed line indicates the crest of the most recent maximum limit of ice advance in 1990. Locations of b, c and d images are also indicated; (b) sinkhole within the buried ice sandur, caused by melting of the underlying ice by meltwater flow through a conduit system; (c) first stage of sinkhole development. The sandur in the background undergoes inundation during high rainfall events; (d) crest of the englacial esker, looking back towards the clean ice margin of Falljökull. Bedded sediments can be seen exposed on the esker flank.
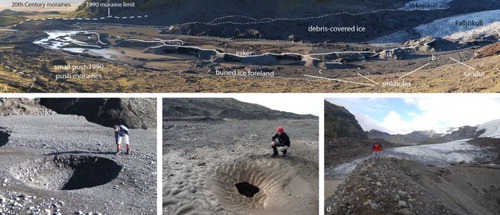
Figure 3. (a) Recent moraines at Virkisjökull-Falljökull, dashed line indicates the 1990 moraine limit, the partially flooded area of buried-ice moraine can be seen in the upper right of the image; (b) Recent moraines at Svínafellsjökull, displaying ‘push moraine’ style cross-sectional form, and ‘sawtooth’ planforms.
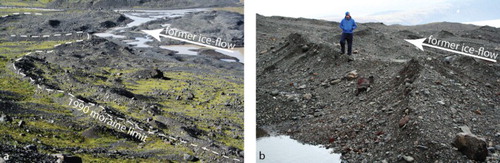
Figure 4. (a) Twentieth-century moraines at Svínafellsjökull, looking towards Skaftafellsjökull; (b) twentieth-century lateral moraines at Falljökull; (c) buried ice hollows within the twentieth-century moraines at Virkisjökull.
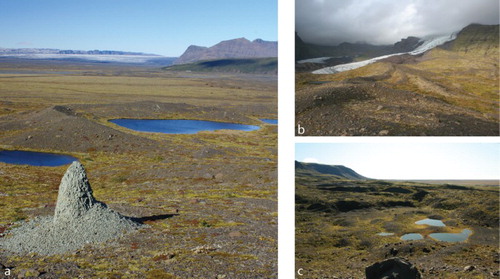
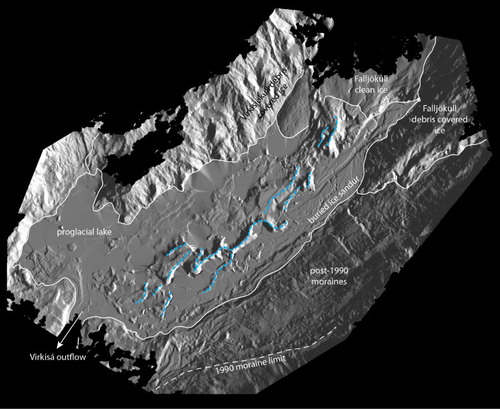
Figure 5. Hillshade surface derived from Terrestrial LiDAR-derived Digital Elevation Model, showing the relationship of the esker (blue line) to the margin of Falljökull and the buried-ice moraine in the proglacial area (within white line marked ‘buried ice sandur’).