
Figures & data
Figure 1. Expansion of Controlled Area and Development Plan from DP-2011 to DP-2031. Source: GoH-DTCP (Citation1991a, Citation2014a), USGS.
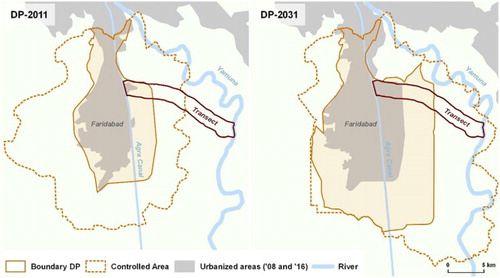
Table 1. Categories for the contextual land-use classification.
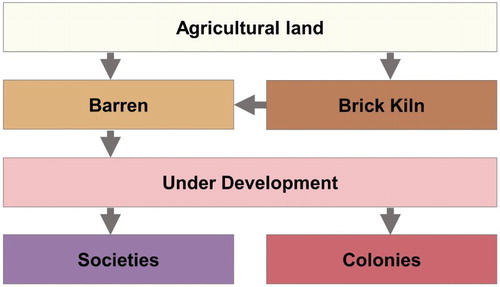
Figure 2. Typical land-use changes of the development pathways. Source: Authors.
Supplemental material