Figures & data
Figure 1. (A) Location of study area, within an overview map of Italy, annotated upon a 40 m Digital Terrain Model (DTM) hillshade (available as WMS Display Services from http://www.pcn.minambiente.it); the yellow rectangle delimits the detail map area. (B) Detail map, annotated upon a false-color hillshade of a Shuttle Radar Topography Mission (SRTM), 90 m DEM (available from CGIAR Consortium for Spatial Information – CGIAR-CSI); the red rectangle delimits the study area.
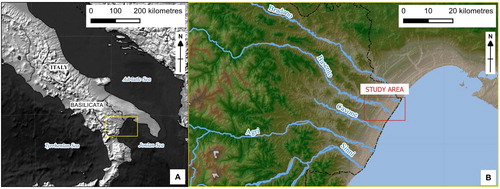
Figure 2. Rainfall and streamflow gauge data recorded during the event for the (A) Bradano and (B) Basento river basins.
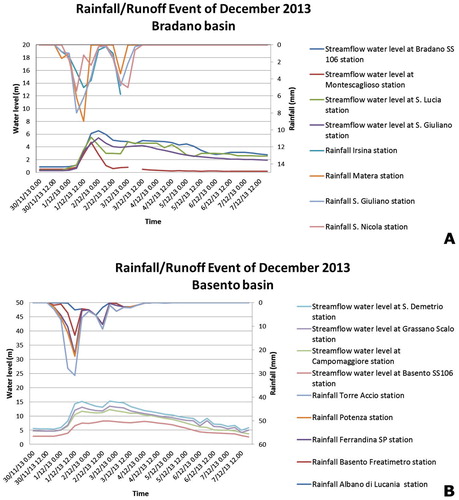
Figure 3. (A–D) Flood effects photographs for the inundated Magna Greciae archaeological site of Metaponto (courtesy of Il Quotidiano della Basilicata). (A–D) detail maps of the archeological area inudation during all the observation period: (A) overview location map, highlighting in the yellow rectangle the area of interest detailed in (B–D); (B,C) water evidence, respectively, on 2 and 3 December 2013 from RGB SAR composition, (D) water evidence on 5 December 2013 from Plèiades-1B HR.
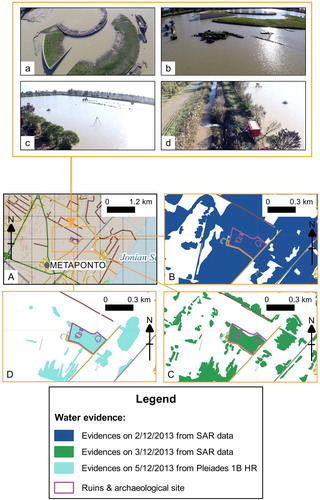
Table 1. Image data availability.
Figure 4. Scheme of the RGB SAR image composition, obtained from the two intensities and the coherence images of the InSAR pair. In the composite image at the bottom-right, areas flooded on 2 December and not on 3 December appear greenish (low red and blue components), areas flooded on 3 December and not on 2 December appear reddish (low green and blue components), while brown-dark areas represent areas affected by the flood event on both days (low R, G and B components).
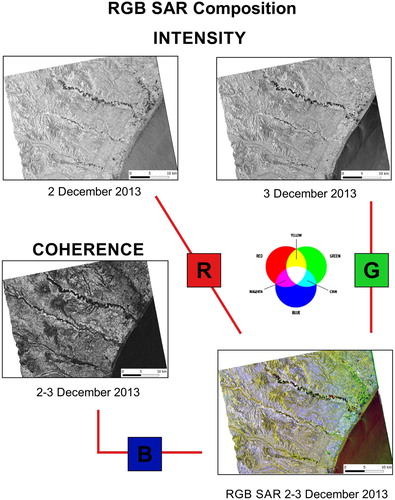
Table 2. Vector data availability.
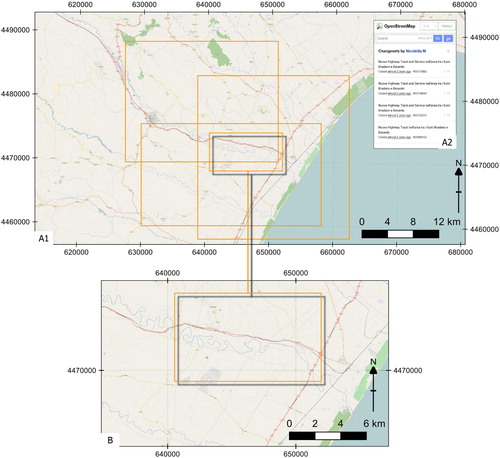
Figure 5. (A1) screenshot of the new Track and Service Highway data as visualized in the OSM database, with some of the changes in the database highlighted in the detail inset (A2). (B) Enlargement of the map in (A1) around an area close to the Bradano River (yellow-shaded rectangle in A1). Brown dotted lines represent the track roads, while grey lines represent service roads, mostly hit by flood effects.