Figures & data
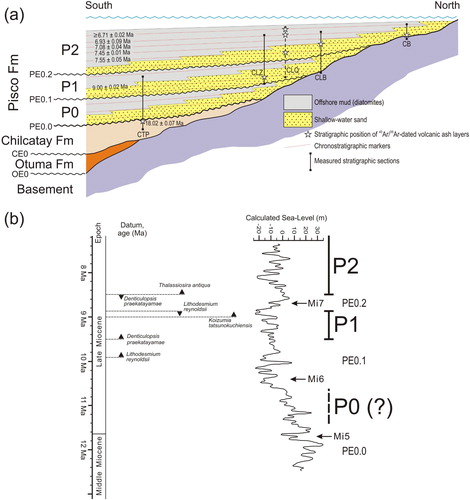
Figure 1. Location maps of the present study. (a) Regional geographic context; (b) annotated air photo image (red box in (a) showing locations of the study area (red frame) and location of the four stratigraphic sections measured at Cerro las Tres Piramides (CTP), Cadenas de los Zanjones (CZ), Cerro la Bruja (CLB), and Cerro Blanco (CB). The areas in the black frame (Cerro Colorado, CC) and in the white frame (Cerro los Quesos, CLQ) have been mapped by CitationDi Celma, Malinverno, Gariboldi, et al. (2016) and CitationDi Celma, Malinverno, Cantalamessa, et al. (2016), respectively.
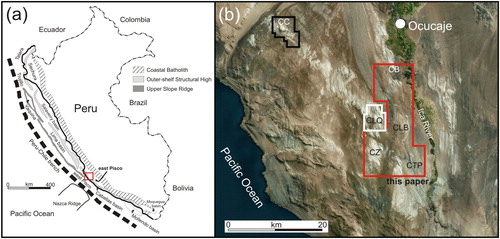
Figure 2. Schematic stratigraphic section of Pisco Formation and adjacent rocks. For simplicity, erosion surfaces have been designated ‘E’ with a preceding letter indicating the relevant formation (C = Chilcatay, P = Pisco) and numbers designating successively higher stratigraphic surfaces. Accordingly, PE0.0, PE0.1, PE0.2 indicate successively younger erosion surfaces in the Pisco Formation. These three unconformities converge and merge landward into a single surface (informally referred to as PE0) representing the composite lower boundary of the Pisco Formation. The resulting allomembers (Amb) have been named for their lower bounding surface. Thus, the P0 allomember refers to strata lying between the PE0.0 unconformity and the next higher unconformity (PE0.1). The vertical scale is only indicative of thickness of sediment packages between unconformity surfaces.
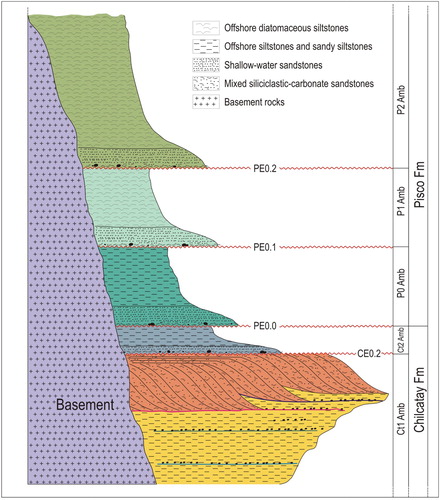
Figure 3. (a) Detail of the unconformity between the P0 and P1 allomembers at Cerro las Tres Piramides (black dotted line). This surface places coarse-grained sediments composed of tightly packed phosphate pebbles, basement clasts, shark teeth, and polished bones surrounded by a sandy matrix (above) in direct and erosive contact with diatomite mudstones (below); (b) below the surface, frequent Thalassinoides burrows are filled with small phosphate nodules; (c) close up of sand-filled gutter casts in the nearshore facies at the base of the P2 allomember. They occur parallel to each other as discrete scours that are usually less than 1.50 m in width and 0.5 m deep. In cross section, these erosional structures display a gently (concave up) curved base and outlines that flare upward. Internally, they are filled with slightly sagging sandy laminae that either drape the margins concordantly or pinch out discordantly against them (Cadenas de los Zanjones); (d) finely laminated diatomites (P2, Cerro Hueco la Zorra); (e) close up view of multiple gravel-filled gutter casts at the base of a gravel bed in nearshore facies. Typically, these linear features are 0.20–0.25 m wide and 0.15 m deep and laterally connected. Lateral spacing is regular, at distances of about 0.3 m. Their cross-sectional shape is generally symmetrical and some have walls with stepped outlines. Gutters show a strongly preferred NE orientation, nearly perpendicular to the inferred shoreline trend. The infill consists of pebble-size phosphatic nodules set in a well-sorted, medium- to coarse-grained sand (base of P2, Cerro Blanco); (f) swaley cross-stratification in fine-grained sandstone produced by storm-induced oscillatory and combined flows (base of P2, Cerro Blanco); (g) oblique view of trough cross-stratification produced in medium- to coarse-grained bioclastic sandstones by migration of lunate bedforms (base of P1, Cerro la Bruja).
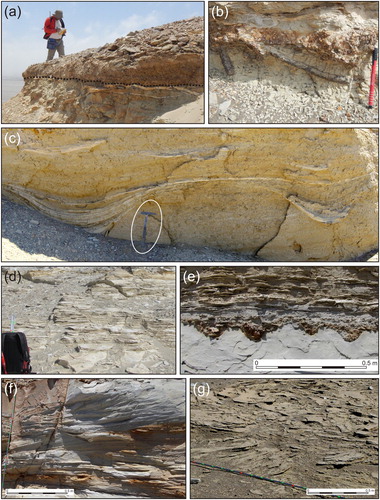
Figure 4. Annotated panoramic photographs of Pisco outcrops showing: (a) eastward view of the upper part of the Chilcatay Formation overlain along an unconformably contact by the marine deposits of the P0 allomember at Cerro los Tinajones (circled geologist for scale); (b) the vertically staked marine deposits of P0 and P1 at Cerro Submarino (circled car for scale); (c) outcrop view of sediments in the vicinity of the unconformity surface between allomembers P1 and P2 (PE0.2) at Cadenas de los Zanjones; (d) crystalline basement nonconformably overlain by P1 strata and ledge-forming marker beds within P1 and P2 (Cerro la Bruja); (e) crystalline basement nonconformably overlain by P2 strata and ledge-forming marker beds serving as formidable correlation tools over wide areas within P2 (Cerro Hueco la Zorra).
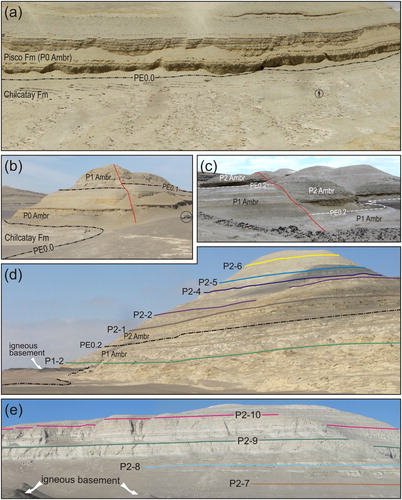
Figure 5. (a) Schematic, dip-oriented stratigraphic diagram for the Pisco Formation (not in scale) showing the position of the stratigraphic sections on which the diagram is based (vertical black lines). Geochronologic data from these sections were supplemented by additional 40Ar/39Ar radiometric ages from Cerro los Quesos (CLQ, vertical dashed line). The Pisco Formation exhibits pronounced thinning to the northeast with component allomembers onlapping onto the basal composite surface PE0 and arranged in a retrogradational pattern, progressively offset to the northeast. The marine erosion surfaces that bound Pisco sequences, namely PE0.0, PE0.1, and PE0.2, were formed as a result of wave erosion in a transgressing shoreline following sea-level lowstands and, therefore, will be close to planar and inclined slightly seaward. Red lines indicate chronostratigraphic markers; (b) correlation of Pisco allomembers with late Miocene sea-level fluctuations by using integrated biostratigraphic and geochronologic data from CitationGariboldi et al. (2017). Diatom biostratigraphy revised following most recent publications on Equatorial Pacific diatom biostratigraphy (mostly CitationBarron, 2003). Calculated sea-level curve from CitationWesterhold et al. (2005).