Figures & data
Figure 1. One of Pierre Ancelin’s isobath maps (courtesy of Rotterdam Stadsarchief).
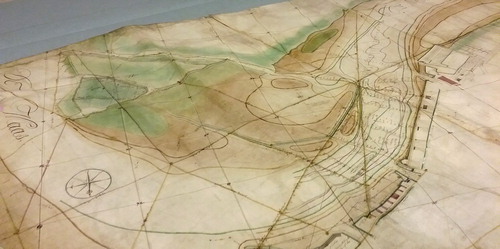
Figure 2. Hutton’s sketch of the mountain Schiehallion and the surrounding land (courtesy of the National Map Library of Scotland).
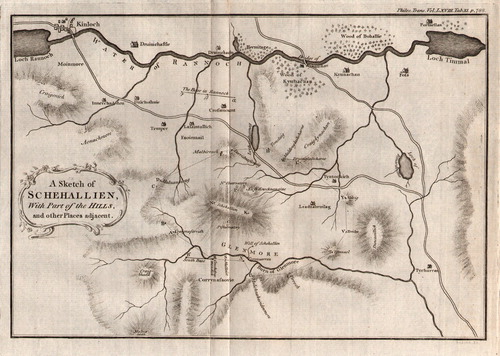
Figure 3. Hutton’s original plan of the positions of all the surveyors’ poles (courtesy of the National Map Library of Scotland).
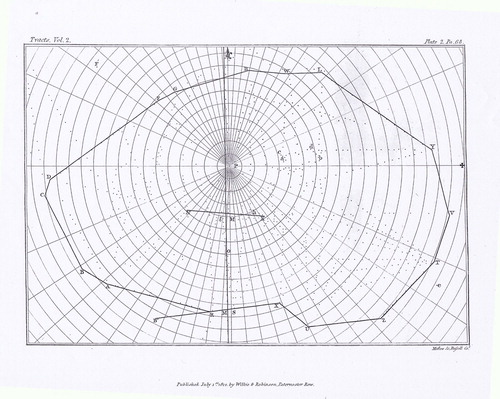
Figure 4. A version of Hutton’s map made by Rann, with the elevations written against each pole position.
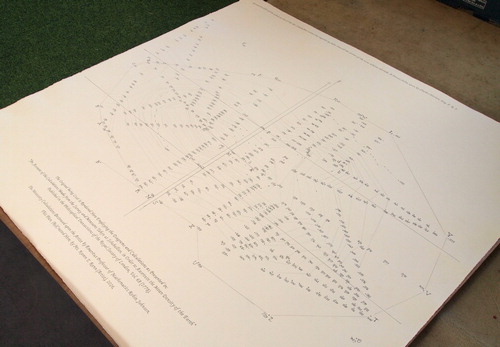
Figure 5. Close up of Rann’s map showing some of the pole positions, elevations and contour lines.
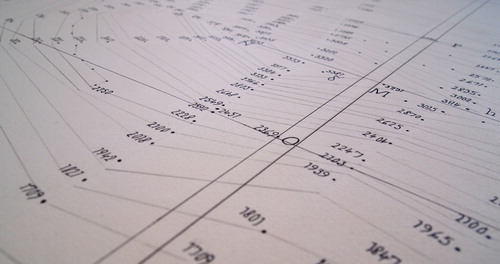
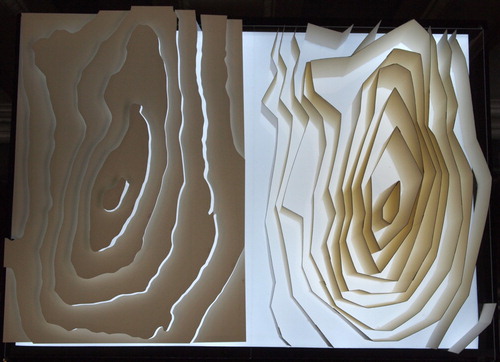
Figure 6. The two models created by Rann: modern OS on the left with Hutton’s on the right.