Figures & data
Figure 1. Sheet 13 (Plate 22) of the ‘Ancient Courses Mississippi River Meander Belt’ published by CitationFisk (1944). The legend in the top right corner shows the colour and pattern choice used by Fisk to present historical river courses (Source: CitationRichards, unknown date).
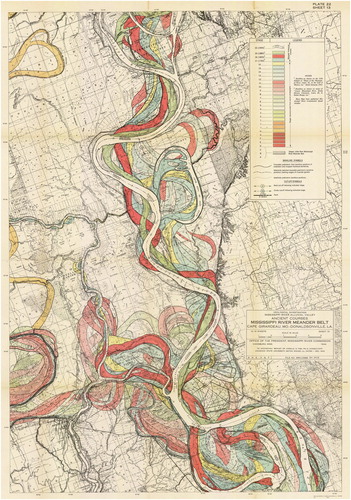
Figure 2. Map of the study area with each area of interest (AOI) in southeastern Louisiana: Old River area, Morganza Floodway area, and Atchafalaya River.
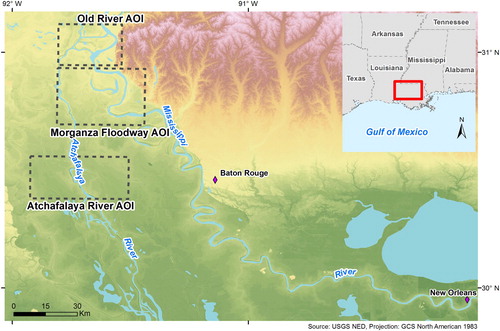
Table 1. Details of data and maps applied in this study.
Figure 3. The cell value distributions and result maps for four classification methods. Here, Old River AOI is selected to demonstrate a variety of landforms and landscapes with different classification methods. In A through D, the y axis is the class number, and the x axis is the number of cells.
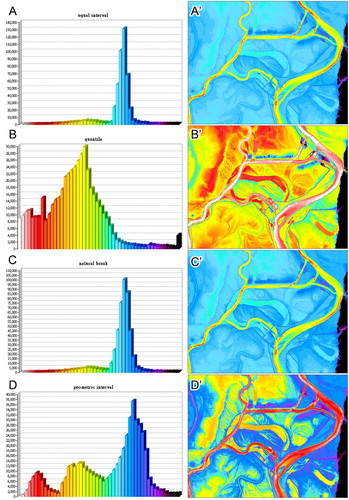
Figure 4. Landscapes and landforms of Old River AOI are discernible from coupled LiDAR-bathymetric data using a 50-class colour scheme design. Dashed rectangles indicate zoom in areas shown in (A,B) and the solid line denotes the A-A’ profile shown in .
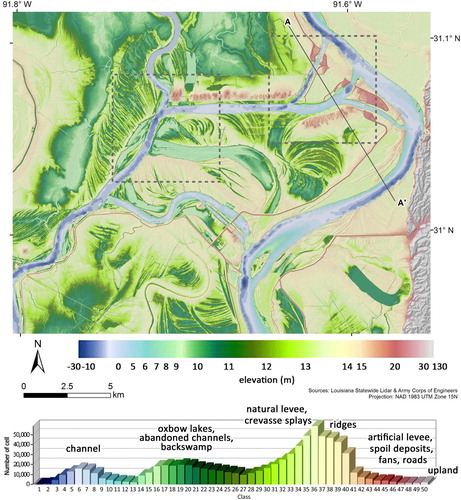
Figure 5. Landscapes and landforms of the Morganza Floodway AOI are discernible from coupled LiDAR-bathymetric data using a 50-class colour scheme design. Dashed rectangle indicates zoom in area shown in (C).
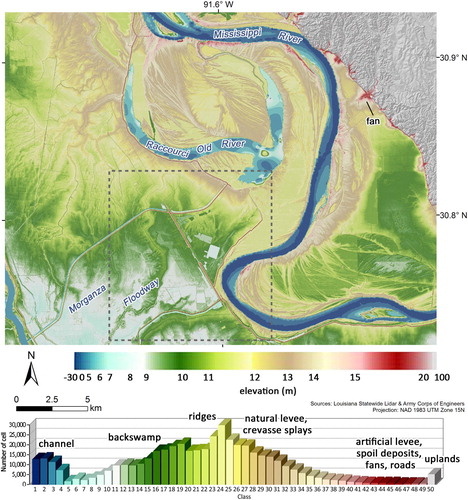
Figure 6. Landscapes and landforms of the middle Atchafalaya River AOI are discernible from coupled LiDAR-bathymetric data using a 50-class colour scheme design. Dashed rectangle indicates zoom in areas shown in (A,B) and the solid lines denote the B-B’ and C-C’ profiles in shown .
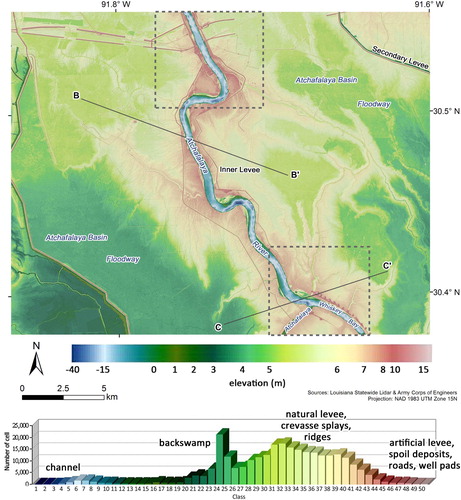
Figure 7. 3D model snapshots from CityEngine Web Scenes: (A), (B), (C) Old River AOI; (D), (E) Morganza Floodway AOI; and (F), (G) Atchafalaya River AOI.
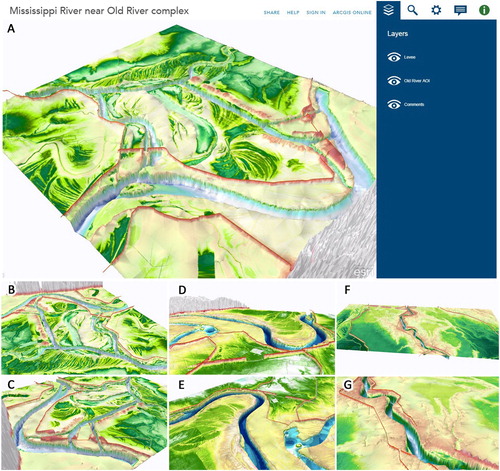
Figure 8. Comparison of combined LiDAR and hydrographic survey DEM (∼2007 data) with parts of CitationFisk’s (1944) historical channel change maps.
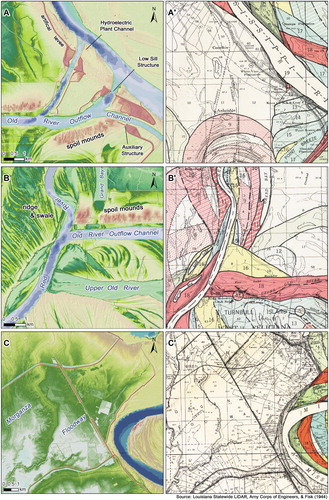
Table 2. Geoscience learning from 2D and 3D renditions of the study area.
Figure 9. Zoom-in view of natural and anthropogenic landforms in part of Atchafalaya River AOI (see for location).
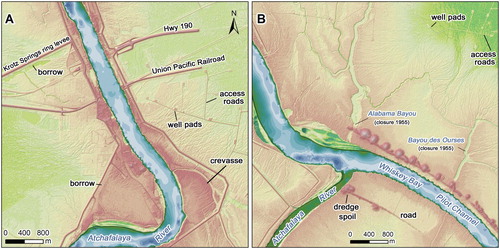
Figure 10. Map of anthropogenic and natural floodplain features in which areas and volumes were quantified above a specific elevation: (A) and (B) parts of Old River AOI (above 15.5 masl); and (C) and (D) parts of Atchafalaya River AOI (above 5.9 masl).
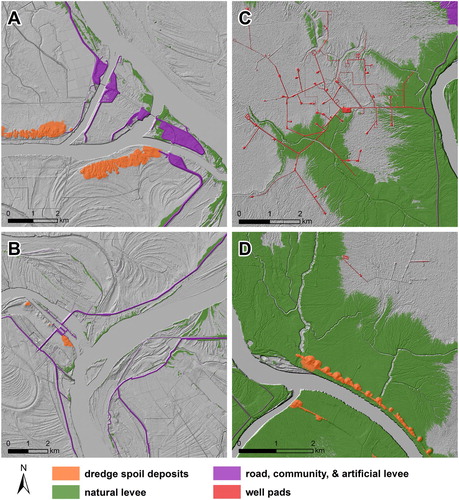
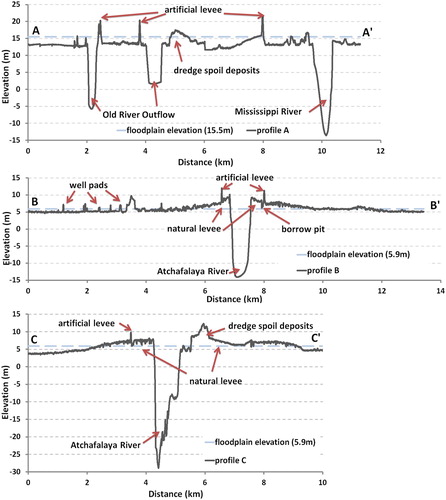
Figure 11. Annotated floodplain cross sections for the Old River AOI (profile A-A’) and Atchafalaya River AOI (profiles B-B’ and C-C’). The locations of the profiles are shown in (profile A-A’) and 6 (profiles B-B’ and C-C’). Arbitrary floodplain elevations (dashed horizontal grey lines) were selected to estimate volumes of different types of anthropogenic and natural features.