Figures & data
Figure 1. Relief terrain of the Rupinaro catchment, located in the eastern Liguria region (northwestern Italy): (a) aspect and (b) slope morphometric parameters.
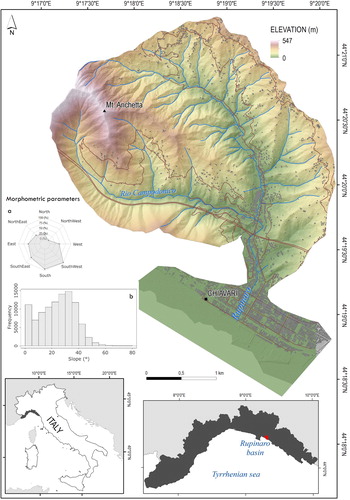
Figure 2. Inventory map of the IFFI (Trigila et al., Citation2008) and autumn of 2014 rainfall-induced landslides, affecting the Rupinaro catchment. The shaded relief derived from the high-resolution DTM obtained from the post-event LiDAR survey.
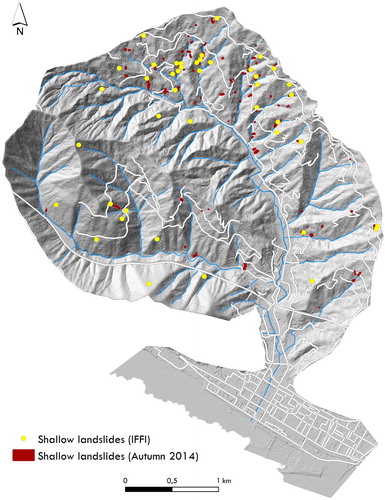
Table 1. LiDAR survey parameters.
Figure 3. Scheme of the adopted methodology.
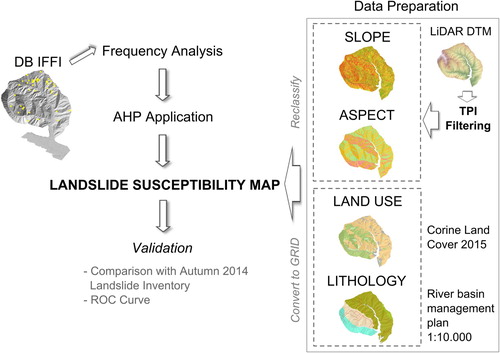
Table 2. Scale of preference between two parameters in AHP (Saaty, Citation1977).
Table 3. Pair-wise comparison matrix and normalized principal eigenvector for landslide causative factors and for the classes within each factor, as required for applying the AHP method.
Figure 4. Landslide susceptibility zonation map of the Rupinaro catchment; dark gray polygons correspond to the shallow landslides occurred during the autumn 2014 rainfall events. (a) Histogram of percentage values of basin areas and landslide areas in the four susceptibility classes.
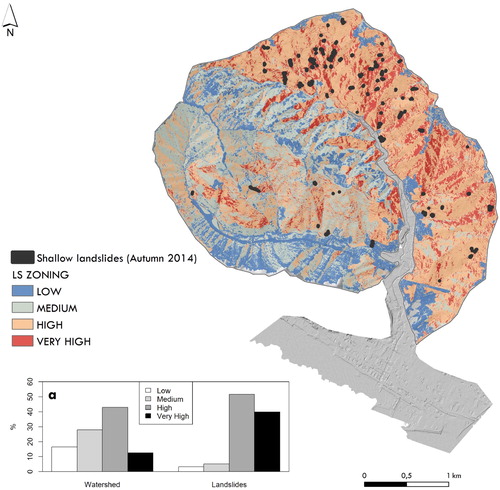
Table 4. Consistency index (CI), random consistency index (RI) and consistency ratio (CR) values for the causative factors considered.
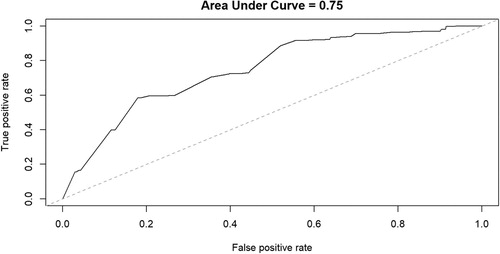
Figure 5. ROC curve computed on the basis of a comparison between landslide grid cells and landslides susceptibility grid.