Figures & data
Figure 1. (a) Map showing the study area and its subdivision in landslide mapping perspective. Red labeled polygons indicate regions where specific data and processing/mapping methods were adopted for landslide identification. Light blue lines indicate major streams and grey lines indicate watersheds of the study area. Red symbols indicate position of historical ground based photo reported in and labeled yellow polygons indicate major villages of the study area. (b) Geologic map of the study area simplified from CitationVitale and Ciarcia (2018) showing rocks forming slopes pf the study area. Pyroclastic deposit extent covering reliefs, interpreted by NDVI map, is shown as superimposed symbols. UTM 32 N coordinates are shown at maps edges.
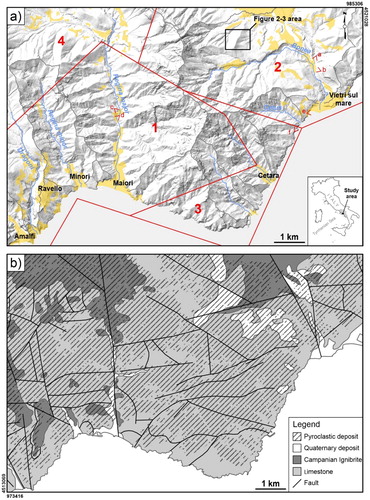
Figure 2. Examples of landslides mapped through visual interpretation of digital ortho-rectified aerial imagery. Yellow lines indicate landsides boundaries and light blue dots indicate source area apexes. See for position of the sample area.
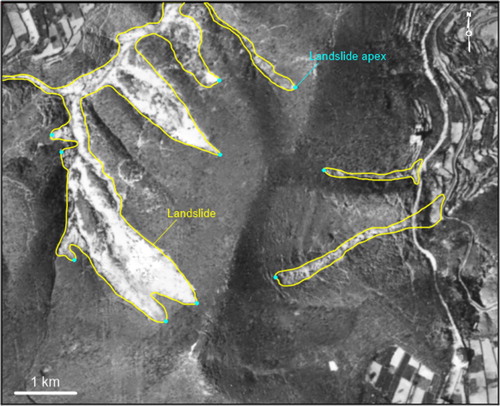
Figure 3. Landslides of classified as function of the process. Yellow areas indicate debris avalanche processes occurring along slopes and outside from channels. Orange areas indicate soil slide initiated debris flow processes occurring within drainage channels.
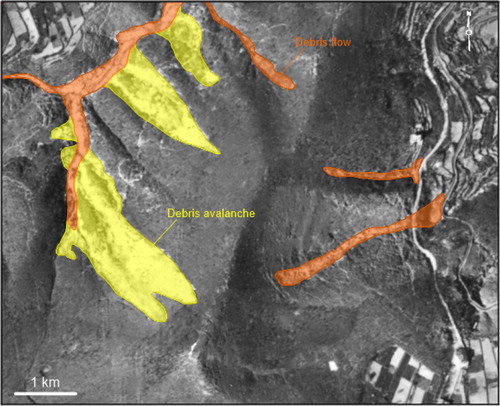
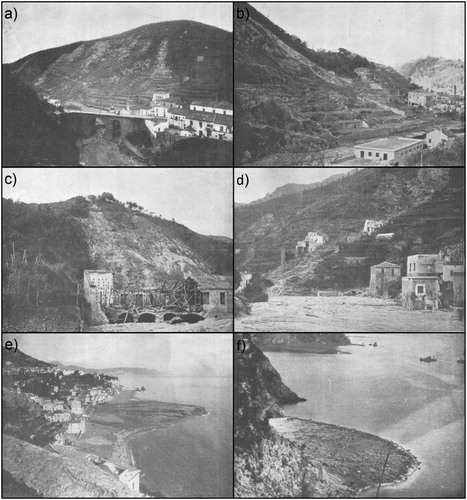
Figure 4. Historic images of the effects of the storm in the Vietri-Maiori area (CitationS.I.M.N., 1954): (a) landslides triggered along the right side of the lower Bonea stream, (b) effects of landslide triggered along the Bonea stream, (c) landslide triggered along the right slope of the Regina Major stream, (d) landslide and flood deposit along the course of the Regina Major stream, (e) debris fan formed at the mouth of the Bonea stream, (f) debris fan formed at the mouth of the Albori torrent. See red symbols of for interpreted positions.