
Figures & data
Table 1. Summary of the methodologies designed to assess single hazards used for calculation of hazard indices and hotspot map.
Figure 1. Geo-lithological and structural sketch map of the study area.
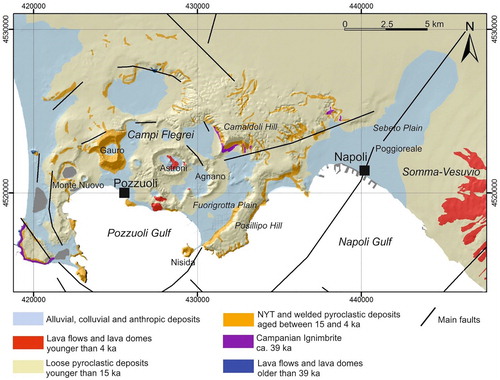
Figure 2. Maps displaying natural hazards characterizing the Napoli and Pozzuoli municipalities: (a) volcanic hazard; (b) seismic hazard; (c) landslide hazard; (d) flood hazard; (e) coastal erosion hazard. On the bottom right of the figure, the shaded relief of Campania Region shows the two municipalities in a wide territorial setting.
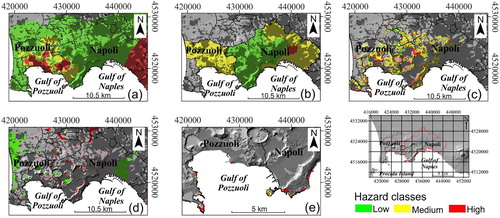
Figure 3. Comparative diagrams between Vs values obtained using empirical correlations NSPT-VS and using correlations with Neapolitan lithotypes.
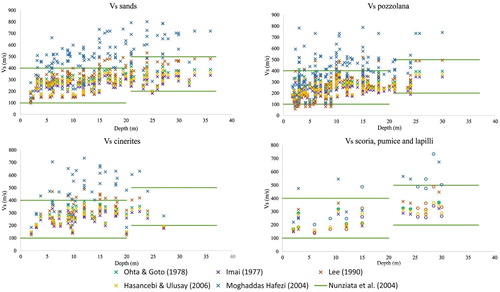
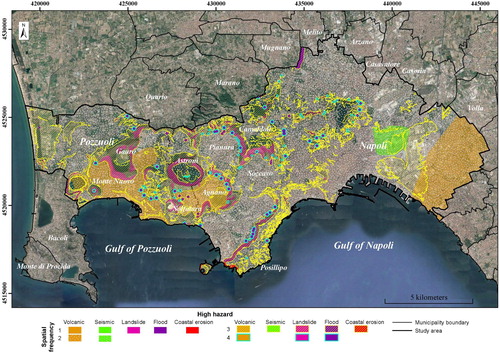
Figure 4. Hotspots map displaying both areas affected by high hazard for the single dangerous event and areas characterized by the concomitance of two or more hazards.
Supplemental material