Figures & data
Figure 1. Schematic map showing the location of the Nanchititla dike swarm and the geological setting. (a) The Nanchititla dike swarm is located in the eastern Michoacán state. (b) The mapped dike swarm inside the red square is located at the western end of a regional lineament of Eocene-Oligocene volcanic centers and left lateral faulting indicated by NW-SE purple lines in the map (CitationMorán-Zenteno et al., 2007). Shortening structures with N-S axis in grey lines appear at both sides of the studied area.
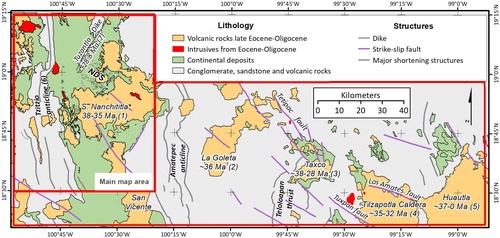
Figure 2. A view of the two main structures that limit the Nanchititla dike swam at the east and west side. (a) N-S section of the Tzitzio anticline in contact with the red beds that host the Eocene-Oligocene dikes. (b) A west to east view of Sierra de Nanchititla, constituted by a thick package of ignimbrites in contact with Oligocene lavas that rest unconformably on the red bed sequence.

Figure 3. Dike outcrop showing typical porphyritic textures with high plagioclase phenocrysts content. In (a) the dike-host rock contact is observed, the circle in blue enclosed a section of dike rock in situ that contains giant plagioclase phenocrysts. Photograph (b) is a close up of the area in the blue circle that shows individual plagioclase phenocrysts and glomeroporphyritic clots of plagioclase. (c) The groundmass shows an intersertal texture, here is shown a close view of plagioclase phenocryst twinning. (d) Rocks were classified according to the phenocrysts size distributions calculated with CSD Corrections from CitationHiggins (2000). The calculation of Crystal Size Distribution uses geometric parameters of an ellipse (white line) that approximates to the 2D phenocrysts outlines (light blue line).
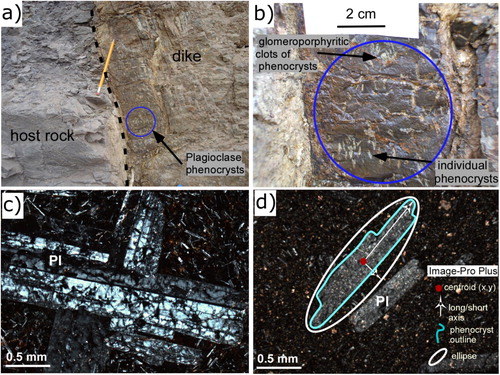
Table 1. A summary of geochronological data that includes new, recalculated and previously reported ages for Nanchititla dikes and other magmatic units.
Figure 4. 40Ar-39Ar age spectra, preferred age and inverse correlation diagram; respectively, for samples: (a and b) MFD 8, (c and d) MFD 49, (e and f) MFD 78, (g and h) MFD 92A, (i and j) MFD 92B. Geochronologic data and sample location are reported in . When available duplicate experiments on different mineral phases are indicated. Dating was performed at the Laboratorio de Geocronología of CICESE (Centro de Investigación Científica y Educación Superior de Ensenada Baja California). Acronyms: tp, plateau age; tc, inverse correlation diagram age.
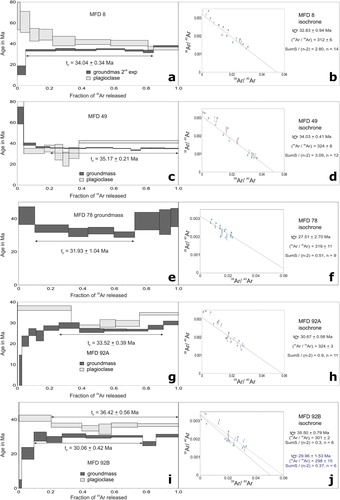
Figure 5. Distribution of dike orientation and thickness in the Nanchititla dike swarm (a and b). Some dikes have planar and tabular geometries as shown in (c). Photograph (d), (e) and (f) are examples of finger-like dike intrusions are a single segment or several segments formed from the main dike intrusion. Dike-sill systems were also observed at different levels of the host rock as shown in incise (g) and (h).
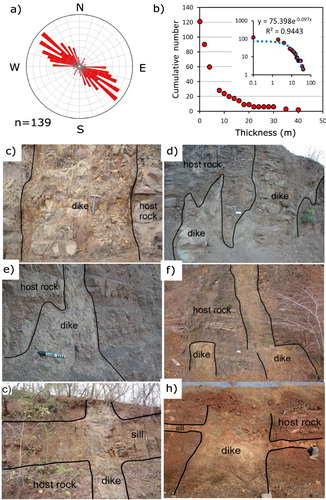
Figure 6. Rock samples that show the contrasting plagioclase phenocrysts size content in Nanchititla dikes. N, M, G and Nv classification is based on the results of Cristal Size Distribution Analysis made for these rocks using the method of CitationHiggins (2000). Nv is aphanitic texture Most of the dikes have porphyritic textures being the N type (Pl < 0.5 cm) the most abundant.
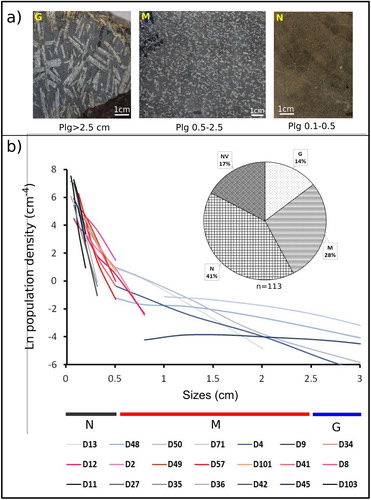
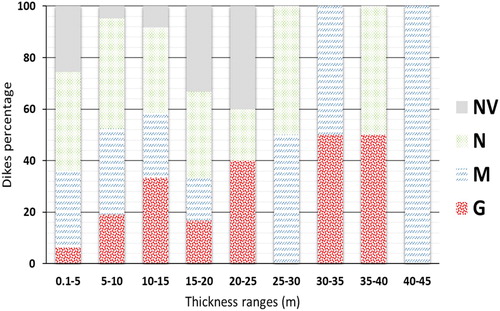
Figure 7. Percentage of dikes with G, M, N and NV type rocks in different range of dike thickness. The percentage was normalized to the maximum number of dikes observed in each range.