
Figures & data
Figure 1. Geological position of Mongolia in the frame of CAOB, according to CitationNguyen et al. (2018), modified from CitationBuriánek et al. (2017).
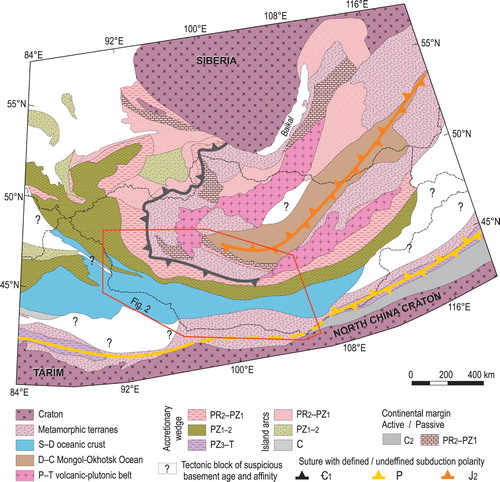
Figure 2. Position of map sheet L-47-V within geotectonic map of SW Mongolia (modified from CitationNguyen et al., 2018).
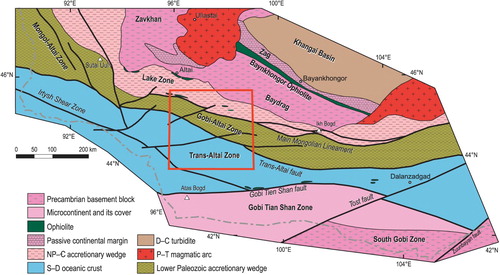
Figure 3. Lithostratigraphic scheme of the Trans-Altai, Gobi-Altai, and Lake zones. Metamorphism: H, M, L – high, medium, low; P, T – pressure, temperature.
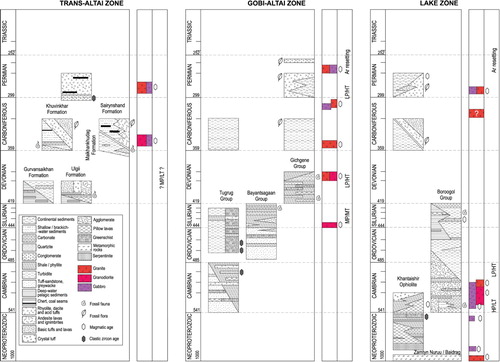
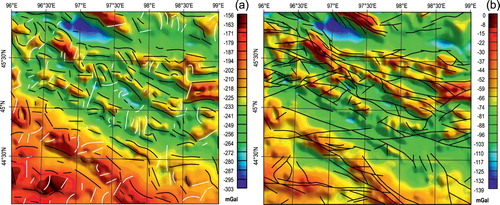
Figure 4. (a) Bouguer gravity anomaly map with interpreted lineaments: black lines are the NW–SE lineaments while white lines represent the NE–SW lineaments and (b) Isostatic residual gravity anomaly map with the superimposed faults depicted from the geological map.
Supplemental material