Figures & data
Figure 1. (A): View from Vesuvius cone; in the background the Somma inner caldera wall; in the foreground 1944 lava flow. (B): Somma-Vesuvius (Google Earth image). (C): Valle del Gigante, view from Mt. Somma, Cognoli di Levante. In the foreground Somma spatter cone (Cognoli) and lavas (LSC formation in the main map), and in the background, 1944 lava (lv20 in the main map, centre of picture) and 1944 hot avalanche deposits (1944 va in the main map) overlying the lava flow and Colle Umberto exogenous lava dome (left).
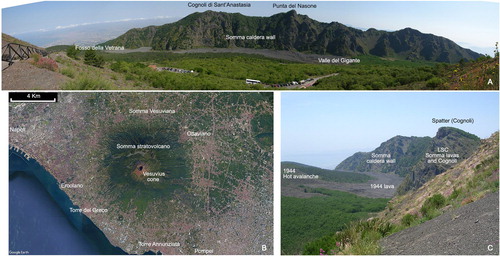
Figure 2. Simplified chronostratigraphic sequence (not to scale) of Somma-Vesuvius. Arrows refer to explosive eruptions, length and colour (blue = VEI 2; green = VEI 3; orange = VEI 4; red = VEI 5) reflect the estimated VEI (data from CitationCioni et al., 2008); dashed arrows mark eruptions of uncertain source. Yellow boxes show periods of persistent strombolian and effusive activity.
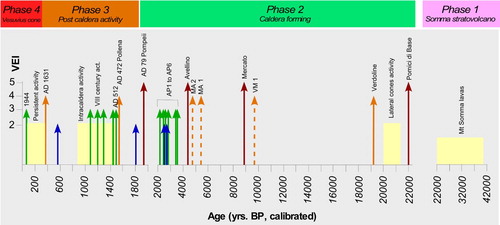
Figure 3. Geological and structural sketch map of Somma-Vesuvius. Submarine gas emission areas from CitationCaliro, Chiodini, Avino, Cardellini, and Frondini (2005).
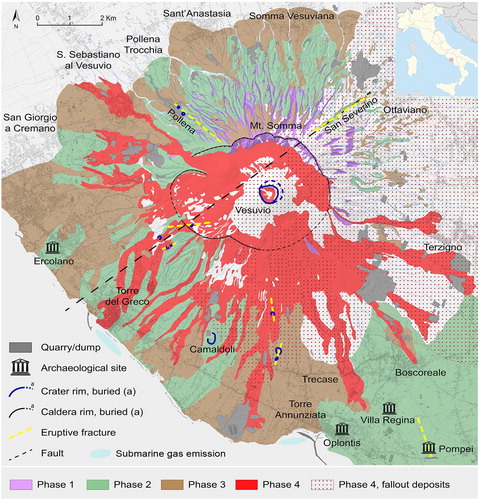
Figure 4. (A) Traianello quarry. The white pumice layer in the middle of the sequence is the base of the Mercato Pumice fallout, followed on top by pyroclastic flow unit. The thinly stratified fallout deposits of Pomici Verdoline and Campi Flegrei Agnano Pomici Principali are visible below the Mercato Pumice. (B) The fallout sequence (white and grey beds) of the Avellino Pumice. (C) Panoramic view of the Post AD 472 sequence in the area of Terzigno. The sequence is formed by the superposition of scoria and ash fallout beds of several eruptions. The light coloured deposits at the base of the sequence record the final pyroclastic density currents and lahars related to the AD 472 Pollena eruption.
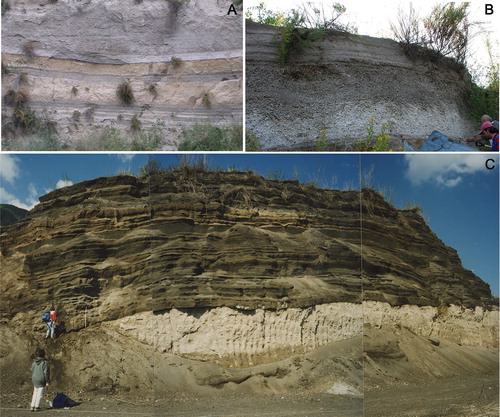
Figure 5. Composition of Somma-Vesuvius products is largely variable through time and within a single eruption. The diagram shows the increasing alkalinity of the erupted products from the Somma lavas up to the most recent products (data from CitationSantacroce et al., 2008).
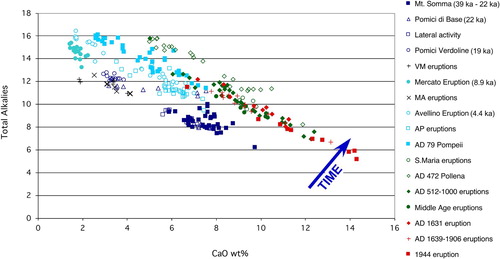
Figure 6. A general consensus exists on the stratigraphy of the AD 79 eruption deposits (CitationCioni, Marianelli, & Sbrana, 1992; CitationSigurdsson, Carey, Cornell, & Pescatore, 1985) with the definition of three different phases. The Opening phase, comprising only a few centimetres of accretionary lapilli-bearing ash fall and very minor surge beds, was followed by the Plinian magmatic phase, mostly consisting of tephra fallout (white and grey pumice layers, phonolitic to tephriphonolitic) dispersed in an elongated fan to SSW. This fallout deposit is the product of a sustained Plinian column, which during the deposition of the grey pumice collapsed at least four times producing low concentration, turbulent pyroclastic density currents (hereafter PDCs). The latter can be found interlayered in the fallout deposits along the slopes of the volcano and in the plain approximately up to a maximum distance of 8–10 km from the vent. According to Pliny the Younger's letters (CitationSigurdsson et al., 1985; CitationSigurdsson, Cashdollar, & Sparks, 1982), the Plinian phase of the eruption lasted no longer than 20 h. It was followed by a phreatomagmatic phase whose initial stages (formation of a short-lived sustained column concluded with the generation of a high-energy turbulent PDC) coincided with the onset of the caldera collapse that enlarged to the South the existing depression left by the preceding Plinian events (CitationCioni et al., 1999). The AD 79 eruption closed with the emplacement of ‘wet’ PDCs and a thick succession of accretionary lapilli-bearing ash beds. The figure contains the stratigraphy of the eruption in the Pozzelle quarry. (A) Close view of the white pumice fallout. At the base it is visible the grey ash of the opening phase. On top of the white pumice is a thin bed of grey pumice fallout followed by the pyroclastic flow deposits related to the total column collapse. (B) Sequence of pyroclastic flow deposits in the San Sebastiano quarry.
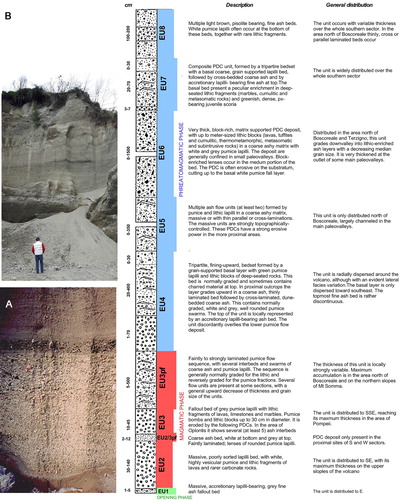
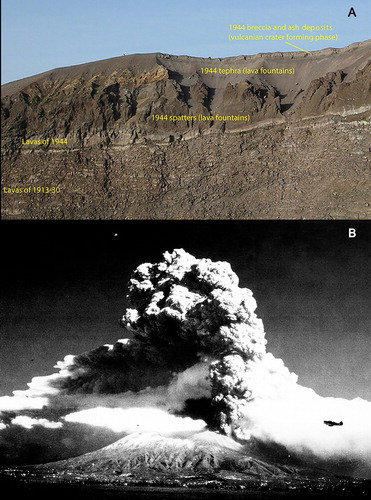
Figure 7. (A) View of the present Vesuvius crater (inner northern), deposits of Phase 4: 1913–1944 lavas (lv19 and lv20 in the main map); 1944 proximal fallout deposits (spatter ss and lapilli fallout in the main map); breccia and ashes (pc in the main map). (B) Somma-Vesuvius and 1944 plume on 24 March 1944 (photo credit: U.S. Air Force Photo Coll. Courtesy of the National Air and Space Museum, Smithsonian Institution).