Figures & data
Figure 1. Location of the study area and main units: hillslope, alluvial fan areas and floodplain areas.
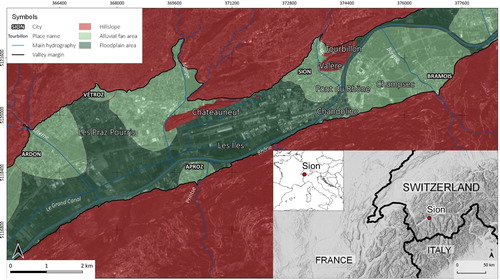
Table 1. Main characteristics of the Upper Rhone River Basin (CitationOlivier et al., 2009) and the data registered at the gauging station of Sion (https://www.hydrodaten.admin.ch/en/2630.html): A – catchment area upstream of gauging station.
Table 2. List of the historical maps considered in this study. ABS: Archives de la Bourgeoisie de Sion; AEV: Archives de l’Etat du Valais. In bold style, the maps used in the ‘backdating approach’.
Table 3. Main characteristics for each period.
Figure 2. The study area as it is represented in the Napoleonic Plan (A), the Dufour Map (B) and the Railway Map (C). (Courtesy of ©Archives de l’Etat du Valais, AEV and Swisstopo).
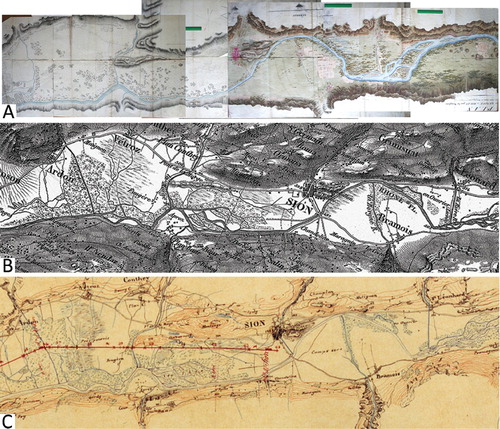
Figure 3. ‘Plan géométrique de la plaine de Champsec/Sion’ digitalised with Agisoft Photoscan (CitationBrandolini & Patrucco, 2019) (Courtesy of ©Archives de l’Etat du Valais, AEV, ABS 99/36). The map is oriented with South at the top of the map.
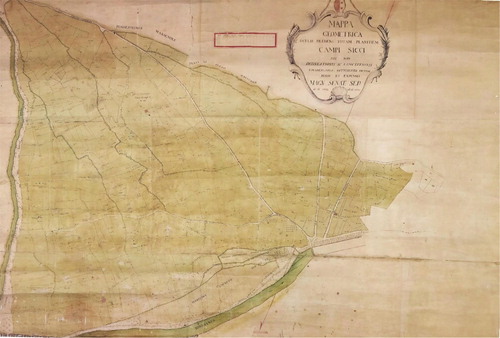
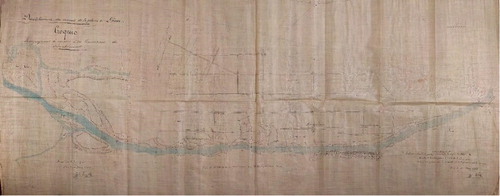
Figure 4. ‘Plan du Rhône entre Bramois et Uvrier’ digitalised with Agisoft Photoscan (CitationBrandolini & Patrucco, 2019). (Courtesy of ©Archives de l’Etat du Valais, AEV, ABS 97/17).
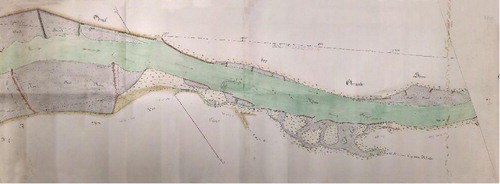
Figure 5. ‘Plan de dessèchement des marais de la plaine de Sion (1857)’ digitalised with Agisoft Photoscan (CitationBrandolini & Patrucco, 2019) (Courtesy of ©Archives de l’Etat du Valais, AEV, ABS 202/11).