Figures & data
Figure 1. Simplified geologic map of a portion of the Blue Ridge Mountains (BRM) in western North Carolina, south of the Grandfather Mountain Window (GMW). The box is the Clyde 7.5-minute quadrangle. HMT, Holland Mountain thrust fault. From CitationStewart et al. (1997), modified to include the Asheville and Waynesville areas from CitationBream (2003); CitationHatcher et al. (2004); CitationMerschat and Cattanach (2008). Structures within the basement rocks have been simplified but include the Unaka-Linville Falls, Fork Ridge, Sams Gap-Pigeonroost, and Fries thrust sheets. Inset shows the geographic position of the geologic map on a digital elevation model of North Carolina where light colours represent higher elevations.
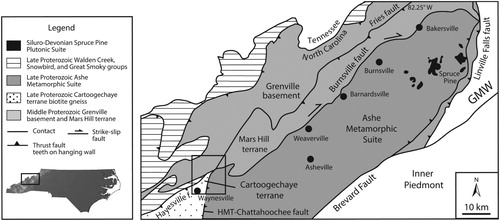
Figure 2. Deformation within the Burnsville fault. (A) Tails on feldspar porphyroclast indicate dextral shearing. Viewed looking down, perpendicular to foliation and parallel to the stretching lineation. (B) Photomicrograph of a thin section with asymmetric quartz and feldspar along with S-C fabrics that also indicate dextral shear. View is the same orientation as A. qtz, quartz; fsp, feldspar; bt, biotite. (C) Shallow stretching lineations highlighted in white and folds suggesting transpression. (D) Fault striations (white lines) record brittle deformation, post-dating ductile deformation and not associated with the Burnsville fault.
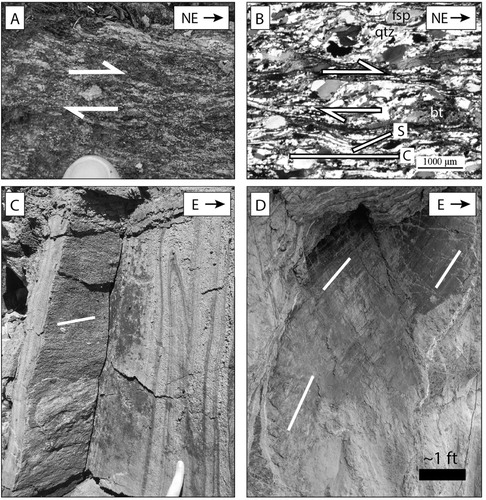
Figure 3. (A) Down-dip stretching lineations highlighted in white, (B) tails on feldspar porphyroclasts, and (C) shear fold at the contact between the Cartoogechaye terrane (ZYc) and the Sandymush Formation (Ys) that indicate top-west thrusting. (D) Sheath folds showing northwest directed thrusting within the migmatite unit of the Cartoogechaye terrane (ZYcm).
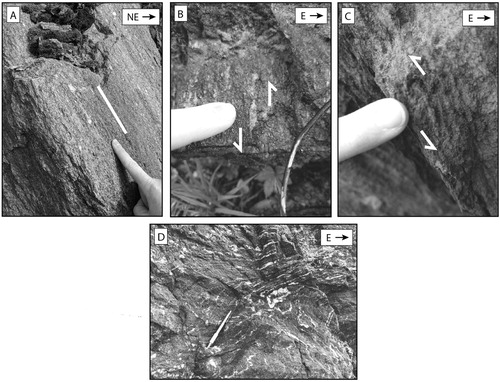
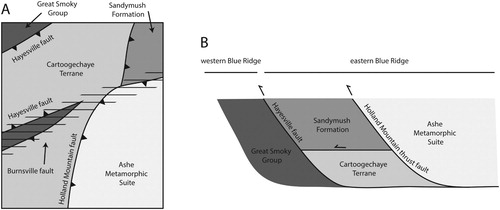
Figure 4. (A) Simplified geologic map of the Clyde 7.5-minute quadrangle with faults and direction of motion interpreted from this study. Triangles are on the hanging wall side of the thrust faults. The dextral Burnsville fault is symbolized with lines where it has overprinted the older structures. Refer to the Main Map for the detailed geologic map. (B) Schematic tectonic interpretation of fault bounded terranes based on data and observations from this study. We interpret that all of these structures were emplaced during the Taconic orogeny and later overprinted by the Burnsville fault.