Figures & data
Figure 1. (a) Location map of the study area. (b) Relief map of the Entella, Rupinaro and Fravega catchments: the white line shows the floodplain analysed. (c) Geographical map of the Entella floodplain.
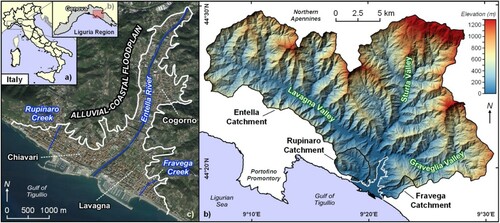
Figure 2. Morphological setting of the investigated floodplain and surrounding areas in comparison with geological features: (a) zone i; (b) zone ii; (c) zone iii. See the text for explanation. (1) Quaternary deposits; (2) Marl and silty marl; (3) Shale, shale with interlayered siltstone and limestone; (4) Divide defining the main contributing areas upstream of the floodplain; (5) Municipal boundary.
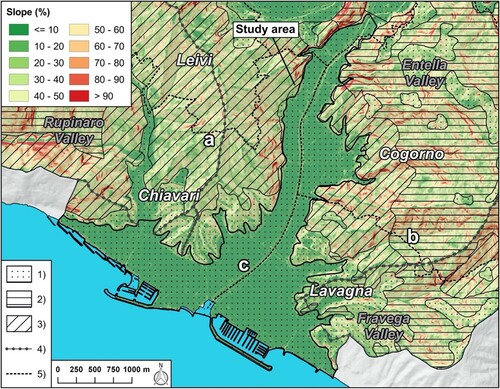
Table 1. Overview of the historical and recent maps used in the research.
Figure 3. The floodplain and shoreline modification over the last two centuries: (a) view of Chiavari and Lavagna in 1890 (‘E. Migone’, photographer archive in Chiavari); (b) recent view of the urbanized floodplain and modified shoreline (P. Giacomelli).
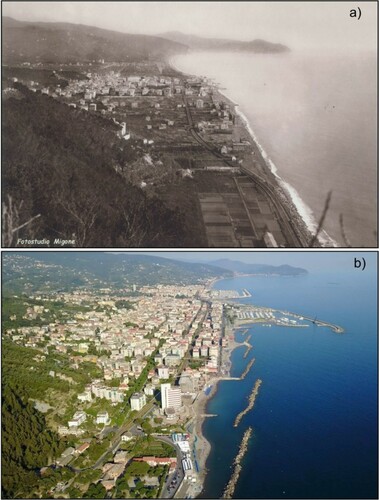
Figure 4. Historical and recent floods that affected the cities of Chiavari and Lavagna: (a,b) streets occupied by waters due to the Entella River flood on December 1910 (‘E. Migone’, photographer archive in Chiavari); (c) the east districts of Chiavari flooded by the Entella River on October 1953 causing one fatalities (Foto Web); (d) the flash flood of the Rupinaro Stream that caused one victim due the collapse of its bank on November 2002 (‘Il Secolo XIX’); (e) Lavagna and (f) Chiavari largely occupied by waters due to the synchronous flash flood of the Entella and Rupinaro rivers on November 2014 (‘Genova Today’).
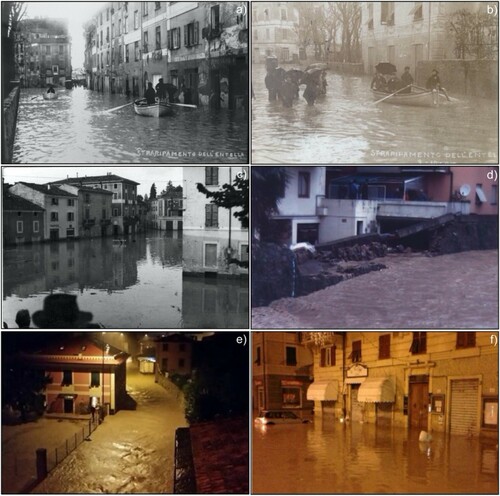
Table 2. Main flood events of the Entella River and Rupinaro Stream since the seventeenth century.
Figure 5 Historical and recent sea storms that affected the shoreline of the Entella floodplain: (a) Chiavari, 1906 (‘E. Migone’, photographer archive in Chiavari); (b) Chiavari, 1955 (‘Museo Marinaro Tommasino-Andreatta’, Chiavari); (c,d) Lavagna, December 1976-January 1977 (‘Tigullio News’); (e) Lavagna, November 2011 (‘Il Secolo XIX’); (f) Chiavari, October 2018 (YouTube).
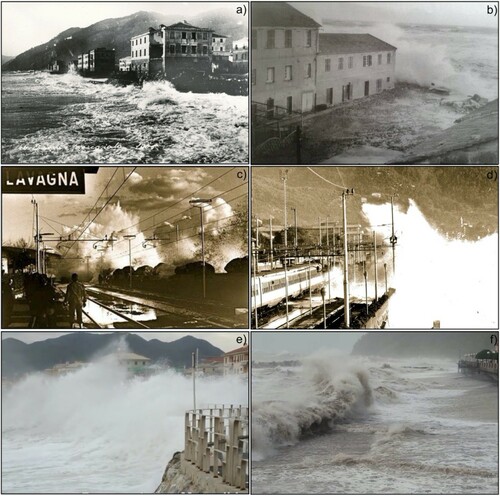
Table 3. Main sea storm events in the Tigullio Gulf since the seventeenth century.
Figure 6. Anthropogenic landforms sketch map.
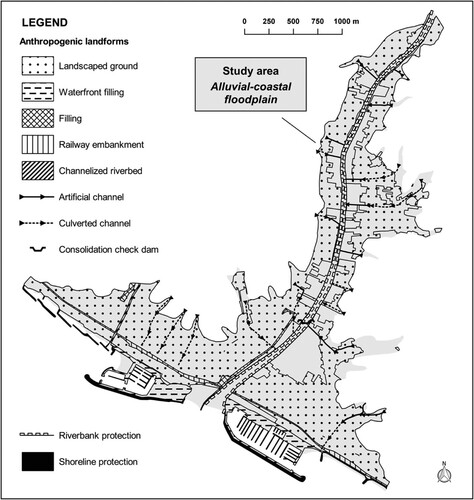
Figure 7. Urban evolution map of Chiavari, Lavagna and Cogorno from 1758 to 2018. (Modified from CitationRoccati, Faccini, Luino, Turconi, Piana, et al. (2018)).
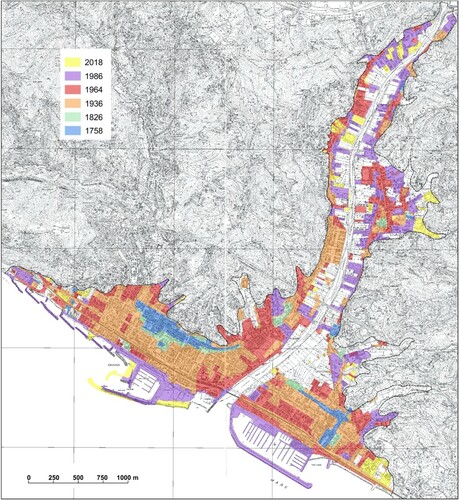
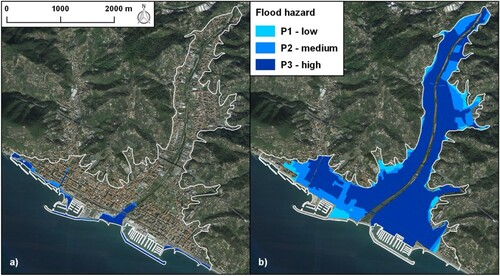
Figure 8. Maps of the urban areas exposed to (a) coastal flood and (b) flood hazard from according to the EU directive 2007/60/CE on the assessment and management of flood risk (CitationLigurian Region, 2014, Citation2015).