Figures & data
Figure 1. (a) Hydrothermally active island of Milos (highlighted in red) located within the Hellenic Volcanic Arc. (b) Close-up of Milos and the study site of Palaeochori Bay. The shaded area around the island represents the extent (35 km2) of observed hydrothermal activity on the island (CitationDando et al., 1995).
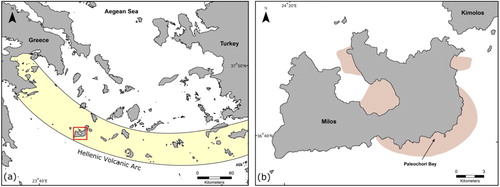
Figure 2. An aerial map of Palaeochori bay produced using 156 photographs from an UAS survey in 2016. White areas indicate bacterial mats, which formed due to the discharge of hydrothermal fluids. The darker areas are sea grass meadows.
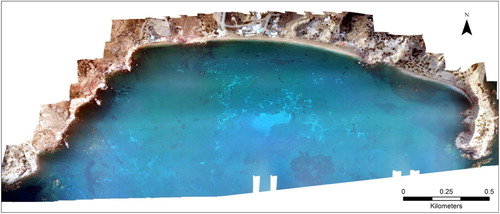
Figure 3. (a) Sampling the bacterial mats, (b) Temperature measurements using the custom-built temperature probe, (c) Typical seafloor features in Paleochori bay showing gaseous discharge, white bacterial mats and yellow-orange hydrothermal precipitates. Water depth is around 4 m. The images were captured with a SeaLife Micro 2.0 underwater camera with a high resolution 16MP SONY® Image Sensor.
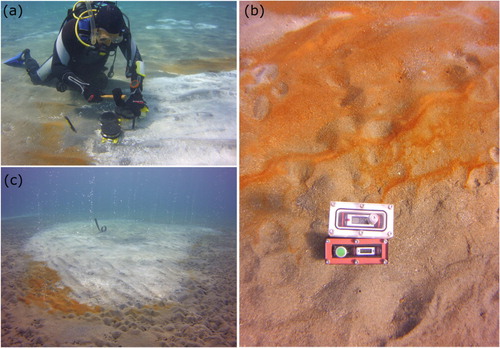
Figure 4. Flight plan for the UAS survey. The flight plan was calculated using the MapPilot software.
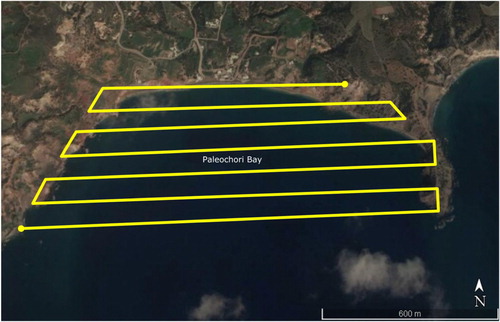
Figure 5. Map showing the sampling locations. Ten transects with the aim to spatially cover the bay were planned in addition to the several individual locations in the areas of interest.
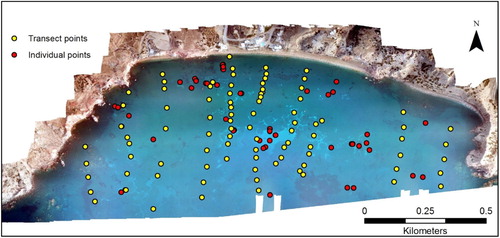
Figure 6. Temperature contour image of Paleochori Bay. The contours were created using the Contour tool in ArcGIS after the temperature data was interpolated across Paleochori Bay.
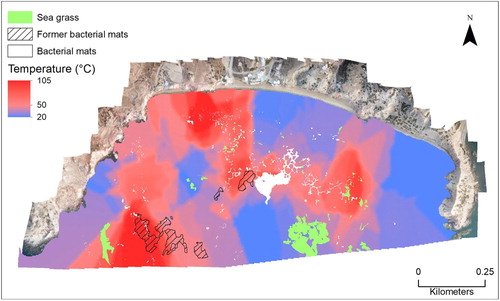
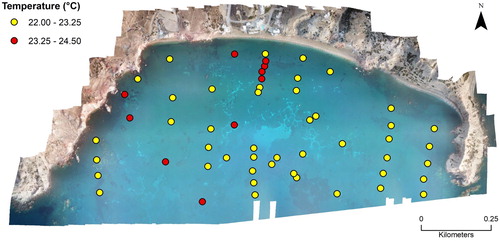
Figure 7. Locations where temperatures below 25°C were measured in the sediment in Paleochori Bay.