
Figures & data
Table 1. Neighborhood deprivation index construct variables and descriptions.
Figure 1. 2010 Southeastern states neighborhood deprivation index (NDI).
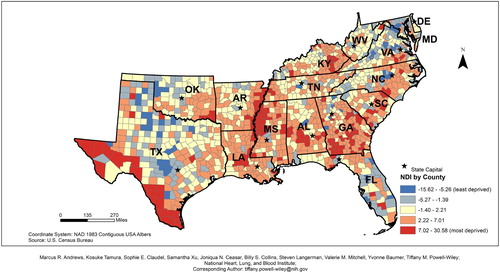
Figure 2. 2010 Northeastern states neighborhood deprivation index (NDI).
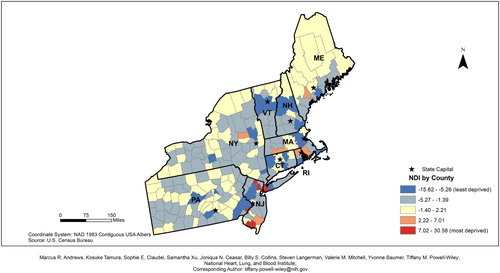
Figure 3. 2010 Midwestern states neighborhood deprivation index (NDI).
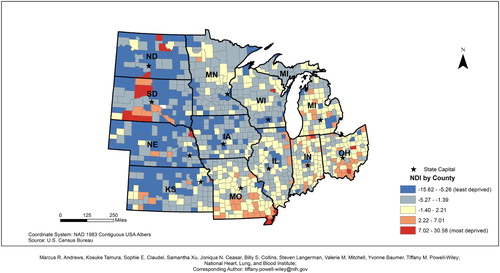
Figure 4. 2010 Western states neighborhood deprivation index (NDI).
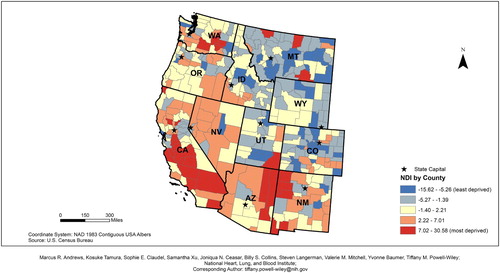
Table 2. Moran’s Ia results for United States and region-specific neighborhood deprivation index.
Table 3. Localized clusters of neighborhood deprivation index (NDI) based on Anselin Moran’s I statistics*.
Figure 5. 2010 Southeastern states neighborhood deprivation Anselin Moran's I results.
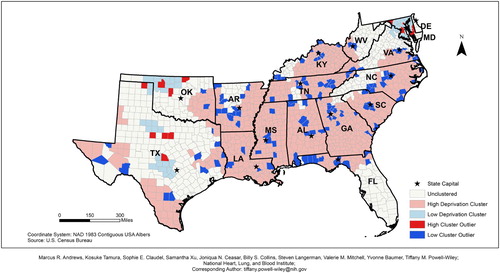
Figure 6. 2010 Northeastern states neighborhood deprivation Anselin Moran's I results.
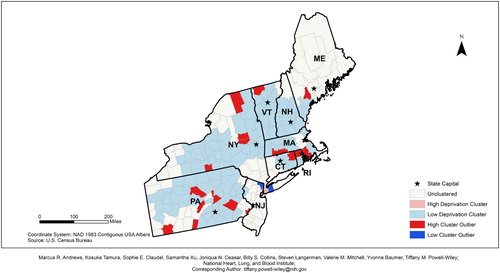
Figure 7. 2010 Midwestern states neighborhood deprivation Anselin Moran's I results.
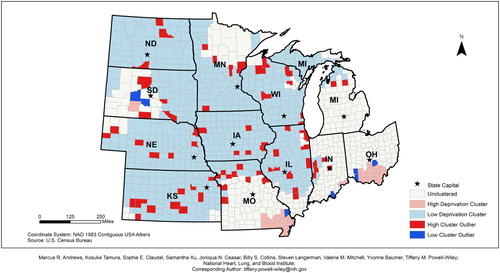
Figure 8. 2010 Western states neighborhood deprivation Anselin Moran's I results.
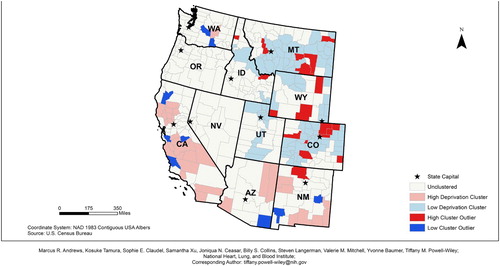
Table 4. County characteristics based on Anselin Moran’s I results.
Supplemental material