Figures & data
Figure 1. (a) Location of the Bagnes valley in the Swiss Alps, with the Giétro glacier and the location of the 1818 ice cone (star). (b) The ice cone (regenerated glacier) and the lake in spring 1818. Unsigned drawing, attributed to Théophile Steinen. (c) The ice cone in 1920. Photographer unknown © ETH-Bibliothek Zürich, Bildarchiv. (d) View on the Giétro glacier in August 2017, with the Little Ice Age moraines (arrows) and the approximate frontal position of the glacier in 1818 (star). Downside is the Mauvoisin dam lake. Photo C. Lambiel.
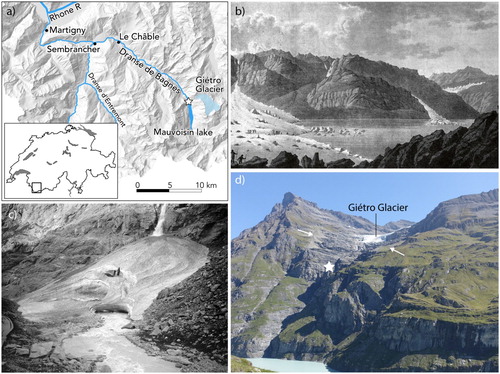
Table 1. Places where historical and/or geomorphological data are available. They are indicated on the map, together with the water depth for a part of them. They can also be visualized on the mapviewer of Swisstopo www.map.geo.admin.ch.
Table 2. Example of sources used to outline the flood extent. ACV: Archives of the canton of Valais.
Figure 2. Shaded DEM (SwissAlti3D) of the Bonatchiesse sector. Well visible is the alluvial fan with the channels built by the outburst flood southeast of Bonatchiesse (dotted white line), as well as the two terraces (black arrows). The star shows the location of the boulders on . The topographic cross-profile through the fan shows the thickness of the deposits. Red squares are the current buildings. Reproduced by permission of swisstopo (BA19054).
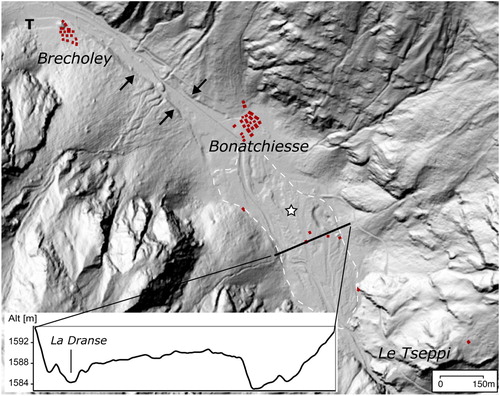
Figure 3. Boulders present in the Bonatchiesse sector on the alluvial fan (See for location).
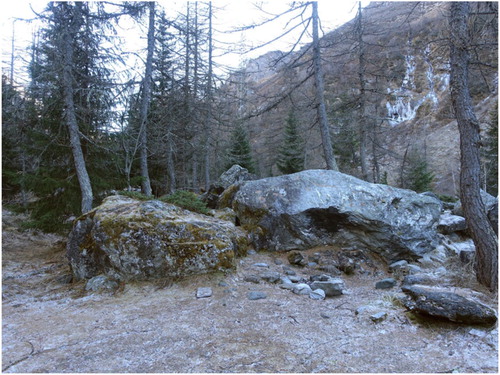
Figure 4. Erosion edge upstream of Brecholey that shows the probable maximum water level during the event (See for location).
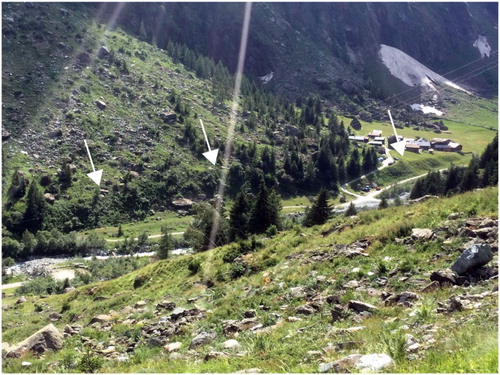
Figure 5. The flood extent in the Bonatchiesse and Brecholey sector.
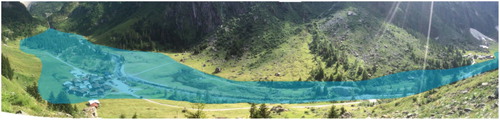
Figure 6. The flood extent between Lourtier and Champsec. The sketch shows the topographic cross-profile through the Champsec plain, from the Versegères alluvial fan (near La Montoz) up to the current river bed of the Dranse River to the ENE, with the convex section due to the sediment deposits. The shaded DEM shows nicely the dry valley (arrow). Reproduced by permission of swisstopo (BA19054).
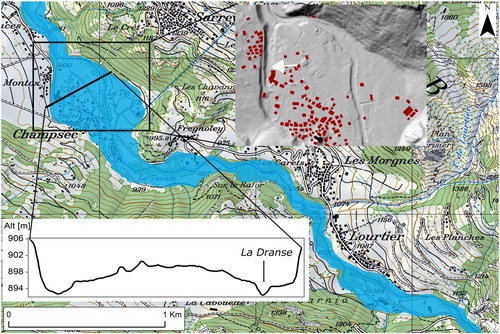
Figure 7. Left: Location of the boulders deposited in Champsec during the outburst flood (dotted line). Aerial photography of 1935, reproduced by permission of swisstopo (BA19054). Right: Close view on one boulder.
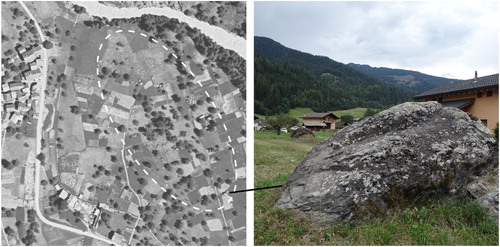
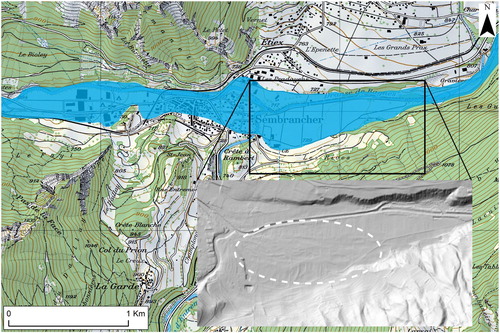
Figure 8. The flood extent in the Sembrancher sector. The shaded DEM shows well the morphology of the fluvial deposits East of the village (dotted line). Reproduced by permission of swisstopo (BA19054).