Figures & data
Figure 1. Up shows perspective view from the eastern scarp of El Estribo, Pátzcuaro Lake and the island of Janitzio (scoria cone). Down shows El Estribo cinder cone as seen from south (photographs of Gemma Gómez-Castillo).
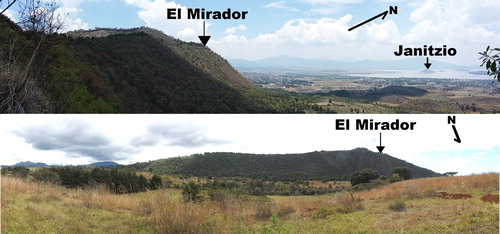
Figure 2. (a) Location of the study area within the Trans-Mexican Volcanic Belt (TMVB), (b) the Michoacán-Guanajuato Volcanic Field (MGVF), (c) Location of the study area to the south of Pátzcuaro Lake. TMVB limits were taken from CitationFerrari et al. (2012) and MGVF from CitationMazzarini et al. (2010). White thin lines indicate state boundaries.
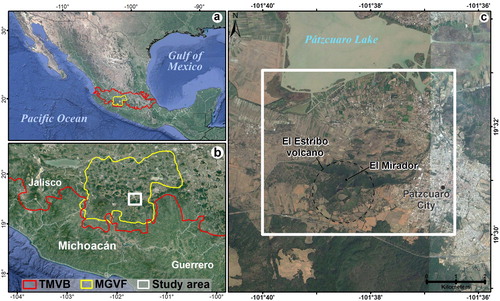
Figure 3. Study area precipitation over a 43 year period between 1969 and 2016. (a) Annual precipitation. (b) Average monthly precipitation. Data from CitationCONAGUA (2017), weather station 16,087 ‘Pátzcuaro’, located at 19.516389° latitude, −101.609722° longitude.
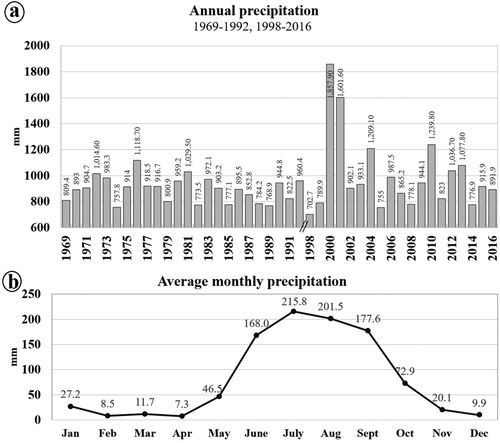
Figure 4. Thematic maps of the study area: (a) Elevation, represented by stretch values along a color ramp, four standard deviations types, (b) Relief energy, grid of 200 × 200 meters, (c) Slope and (d) Potential mass movement.
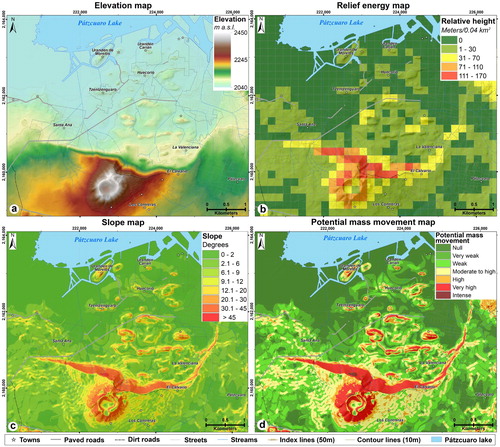
Figure 5. Location, distribution, volume, and length of major axis of hummocks in the study area. The numbers next to the hummocks correspond to their identifiers (Id) in .
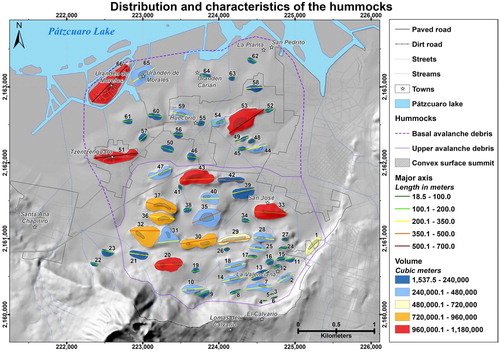
Table 1. Morphological characteristics of hummocks.
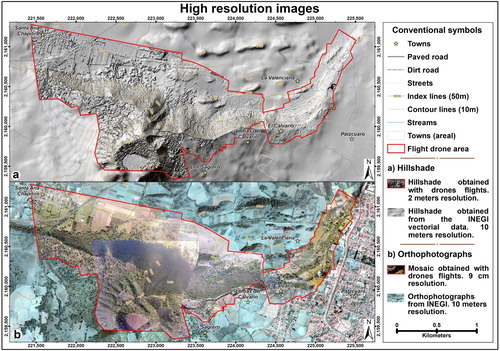
Figure 6. Mosaics of high-resolution images obtained from drone flights. The areas outside of the red polygon are references of the contrast in resolution of the information previously available for the study area. (a) Hillshade model; and (b) Rectified orthomosaic.