Figures & data
Figure 1. a) North America and b) Cascadian arc and Mount St. Helens position (red square).
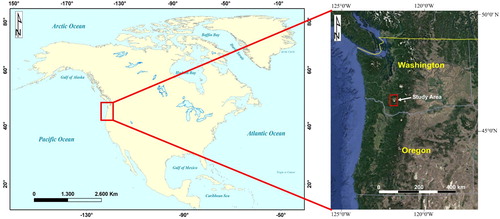
Figure 2. The Northern flank of the Mount St. Helens volcano, in a picture taken from 46°14′N/122°10′W, pointing SW direction. We can notice the open side of the crater (due to the 1980 eruption's collapse) and the newly formed dome inside it.
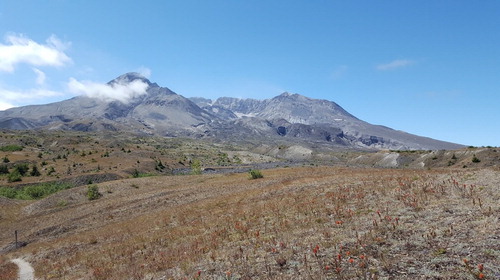
Figure 3. Evolution of the Mount St. Helens crater through the comparison of 2003 LiDAR (a) and 2009 (b). 2009 LiDAR information: Projected Coordinate System UTM Zone 10N; Map Datum NAD 1983.
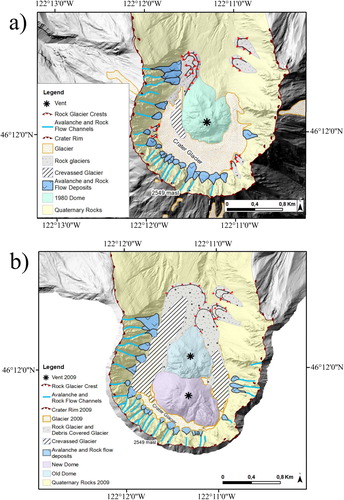
Figure 4. NS Cross-section of the eruption of 1980′s and subsequent formation of hummocky structures (based on CitationLipman and Mullineaux (1981) and Citationvan Wyk de Vries and Davies (2015)): a) Pre-collapse profile; b) First30 seconds of the collapse, with an initial spreading (I, II and III indicate the blocks movement sequence); c) Third stage, with the advancement of the debris avalanche; d) Final stage (30 s after b and c stages), with the blast and hummocks formations due to the avalanche spreading in horst and graben structures.
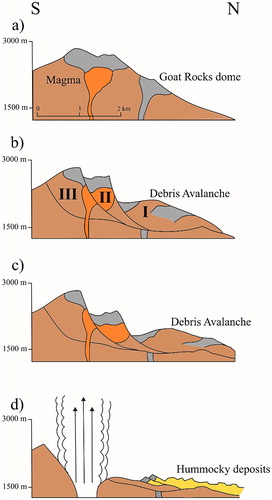
Figure 5. a) Secondary explosion pits from the LiDAR of 2003 and Google Earth image of 2016, located at 46°15′N/122°12′W. The red line corresponds to the GPR survey of this paper. B) The same secondary explosion pit shown from the ground. The GPR profile of was taken along the rim of this pit in summer 2018.
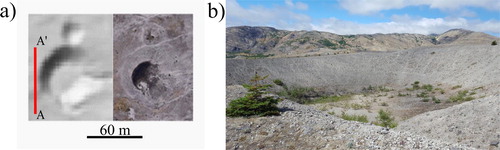
Figure 6. GPR profile of the pit in (A–A’). Red arrows indicate the main interpreted landforms.
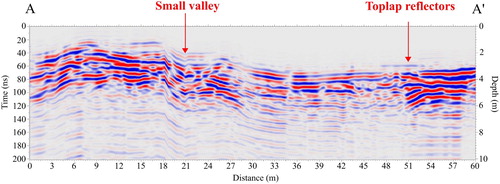
Figure 7. a) Drainage system of Mount St. Helens; b) Slope map of Mount St. Helens.
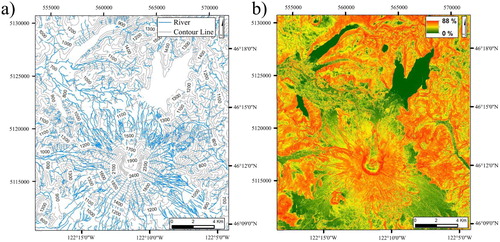
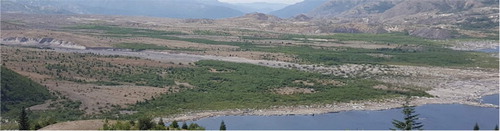
Figure 8. Alluvial fan with a NE direction, flowing into Spirit Lake, pointing East direction.