Figures & data
Figure 1. The mapped area in southern Sweden. (A) Map of the study area showing cited previous maps that include glacial geomorphology. A list of these references can be found in . (B) Locations of are shown with rectangles, ovals or points. The inset in the centre shows the map area as a red polygon in respect to Scandinavia and its surrounding.
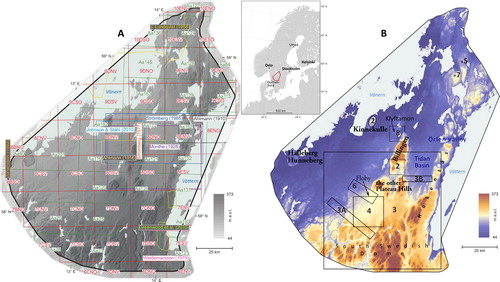
Table 1. List of previous maps in the area, which have included some glacial morphology. Read together with .
Table 2. More than 30,000 features where mapped in this study. The individual count and sum of landforms are displayed, as well as the type of map feature.
Figure 2. Drumlins that extend from the lee side of the plateau hills are special features on the map (one example is pointed out with an arrow). The flat surfaces of the plateau hills are capped with dolerite. The oval inset shows highly elongate drumlins on top of Kinnekulle. Also note ‘pre-crag’ drumlins on the up-ice side of Kinnekulle (arrows). The extent of the figure is displayed in (B).
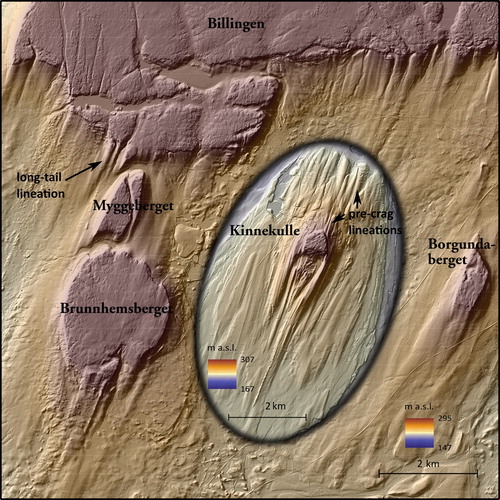
Figure 3. Map showing topography, water level at the highest coastline (a time-transgressive surface), hummock tracts, hummock-corridor margins, eskers, and end moraines in the southern part of the map area. Note that end moraines are lobate where they were formed above the highest shoreline, but their shape is much straighter where submerged. The highest paleocoastline is at c. 115 m above the present sea level in the southwestern part of the figure, c. 120 m a.s.l. in the northwestern parts, and c. 145 m a.s.l. inside the glacial Lake Tidan (see also (B)). Insets show end moraines that mark the (A) Kungslena and (B) Remmene ice-margin positions. Black arrows point at the ends of the most prominent sections. The mapped end moraines are also coloured with a transparent blue colour. The extent of the figures is displayed in (B).
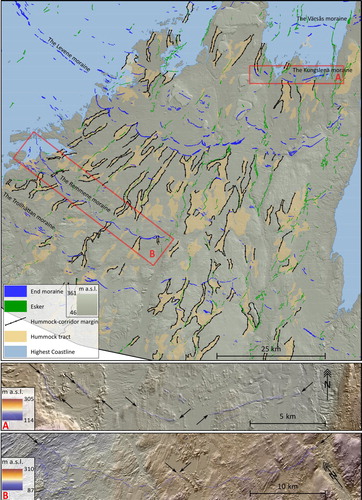
Figure 4. Hummock corridors stand in stark contrast here to the surrounding streamlined drumlin topography. Inset graphs show the longitudinal profiles of two hummock corridors. The extent of the figure is displayed in (B).
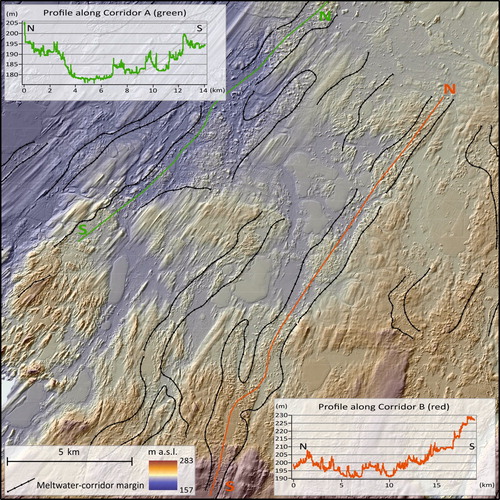
Figure 5. An example of murtoos mapped in the study area. Black arrow displays former ice-flow direction, based on glacial lineations. The murtoos are composed entirely of surficial, glacial sediment. The extent of the figures is displayed in (B).
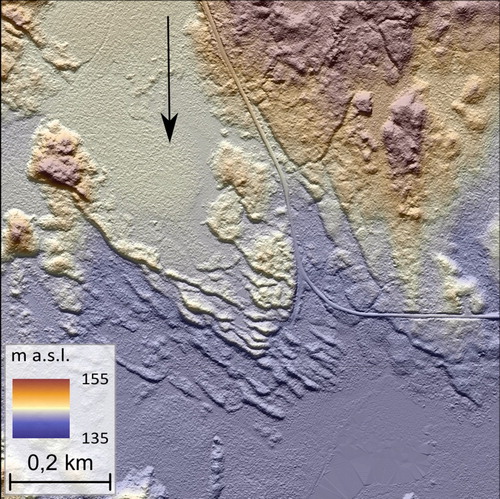
Figure 6. The terrestrial-terminating ice-lobe landforms at Floby. Inside the lobate shape there are ‘crevasse-squeeze ridges’ (CSR) highlighted by red arrows. Another couple of lobes (L) and interlobate areas (IL) are marked. Note the extensive traces of flowing meltwater; channels and corridors. The extent of the figure is displayed in (B).
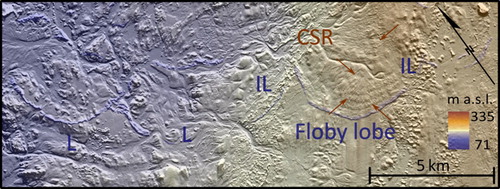
Figure 7. Ice-marginal meltwater channels cut into a drumlin. These channels formed from the drainage of an ice-dammed lake to the east: as the ice retreated, it opened lower passages to the west. The location of the figure is displayed in (B).
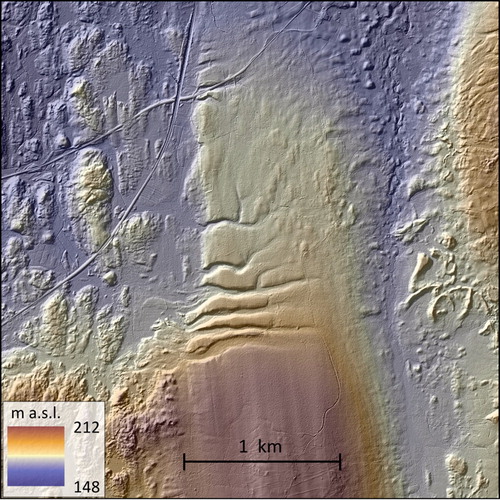
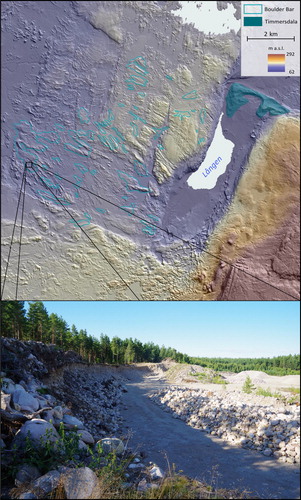
Figure 8. Klyftamon, the Lången valley, Timmersdala ridge, and the northern tip of Billingen. Timmersdala ridge and the boulder bars were formed during the final drainage of the Baltic Ice Lake. The extent of the figure is displayed in (B). Lower picture shows an exposure of drainage sediment at Stora Mon. Drainage-flow direction right to left.