
Figures & data
Figure 1. Slope angle classes map of the Mount Pellegrino and panoramic views of main landscape elements.
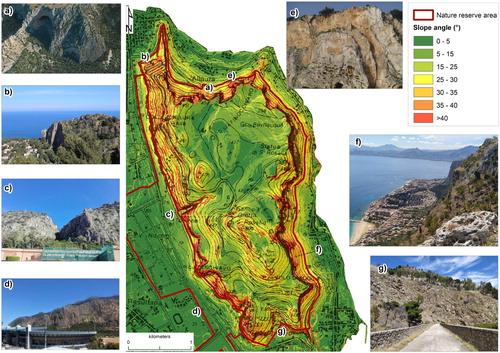
Figure 2. (a) Tectonic scheme (after CitationCappadonia et al., 2020, modified): 1. Quaternary deposits; Structural Stratigraphic Units (USS) deriving from 2. Numidian Flysch; 3. Imerese basin successions; 4. Panormide platform successions; 5. Main thrust; 6. Trace of the geological section of (b). (b) Schematic geological cross-section section through the Conca d’Oro Plain (trace (a); after CitationCappadonia et al., 2020, modified). 1. Slope deposit; 2. Marsala synthem; 3. Numidian Flysch; 4. Panormide succession (upper tectonic units); 5. Panormide succession (lower tectonic units); 6 Fault or thrust. (c) Geological map of the study area (modified from Catalano, 2013). 1. Fault; 2. Anticline; 3. Reverse fault; 4. Normal fault; 5. Left lateral strike slip; 6. Detritus and poor sorted materials (Upper Pleistocene-Holocene); 7. Eluvial and colluvial deposits (Upper Pleistocene-Holocene); 8. Sands (Upper Pleistocene-Holocene); 9. Aeolian Deposits (Upper Pleistocene-Holocene); 10. Conglomerates (middle-upper Pleistocene); 11. Cross laminated aeolian calcarenites (middle Pleistocene); 12. Terraced calcarenites (Calabrian); 13. Bioclastic packstone-to-rudstone (middle Lutezian – late Cuisian); 14. Bioclastic packstone (Cenomanian – Senonian); 15. Bioclastic wackestone-packstone (Barremian – Aptian); 16. Coralgal biolitites (Tithonian – Neocomian); 17. Reddish marly carbonates and nodular pseudobreccias (middle-upper Liassic); 18. Dolomitic limestones and dolomites (upper Triassic – lower Liassic); 19. Massive grey limestones and dolomitic limestones (upper Triassic); 20. Trace of geological cross-section.
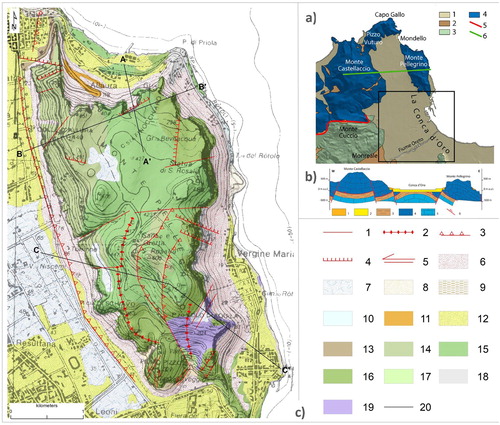
Figure 3. Representative geological cross-sections of Mount Pellegrino area (See for the traces).
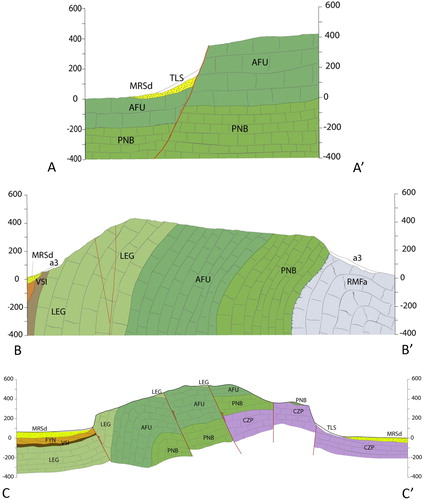
Figure 4. Examples of rock-fall in a main road in northern sector of the study area: (b) rock-fall release area and (c) rock-fall deposits.
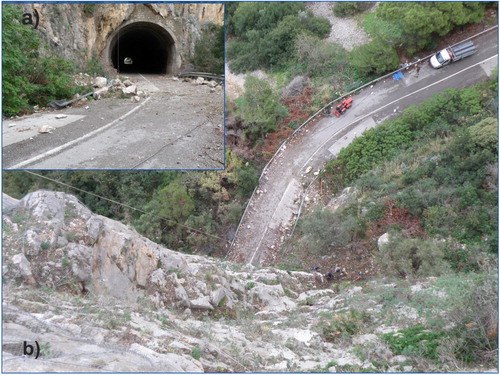
Figure 5. Unstable blocks as a. slabs, b.,c.boulders and d. pinnacles which could involve in kinematics of toppling.
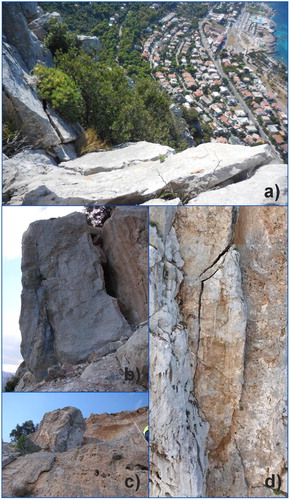
Figure 6. Example of a block-slide along the street leading to the Santuario of S. Rosalia. b. Unstable huge rock block in a rock wall affected by slide phenomena.
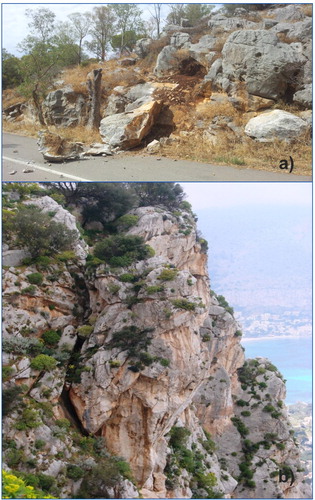
Figure 7. Contour diagram of the discontinuities measured during the scanline surveys in three representative sectors (S1,S2,S3) and values od Dip and Dip-direction relating to the bedding plane (S) and the other discontinuity sets (F1-F4).
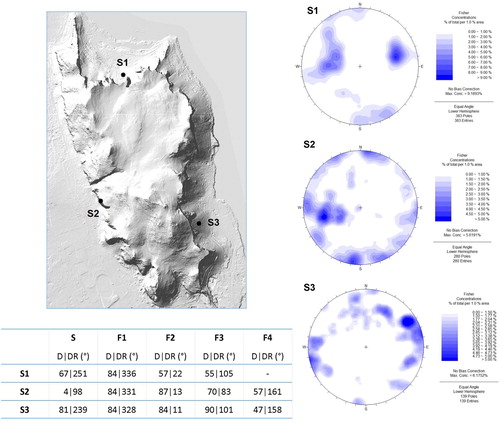
Figure 8. Rock block size distribution and some examples of collapsed and instable blocks in the study area.
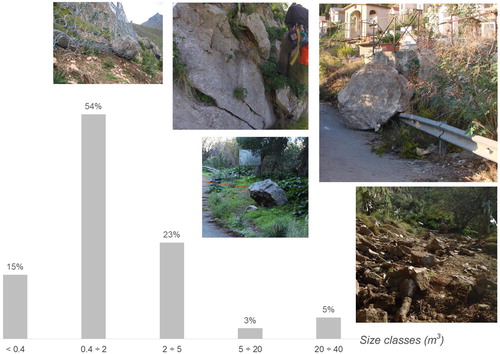
Table 1. Parameters used for the rockfall analysis: Kn. coefficient of restitution of normal energy; Kt. coefficient of restitution of tangential energy; Cr. friction coefficient of the rolling boulders; δ(°). flying limit angle; χ(°). colliding limit angle; j(°). bouncing limit angle; n. number of starting points; v. initial velocities; d(°). maximum angular deviation; N. Number of trajectories.