Figures & data
Figure 1. Location of the study site. Alimit River Sub-watershed is situated in the northern portion of the Island of Luzon, Ifugao Province, Philippines.
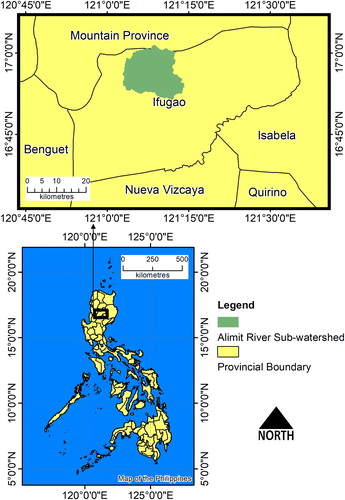
Figure 2. Mechanics of soil erosion relating to sediment concentration and fluxes (CitationRose & Freebairn, 1985). The symbol e represents rate of rainfall detachment; d, rate of deposition; and r, rate of entrainment of sediment.
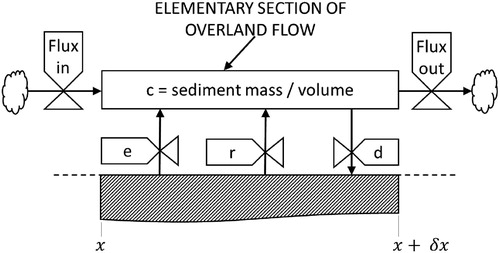
Figure 3. Location of tipping-bucket rain gauge and water-level recorder overlain on the DEM of Alimit River Sub-watershed.
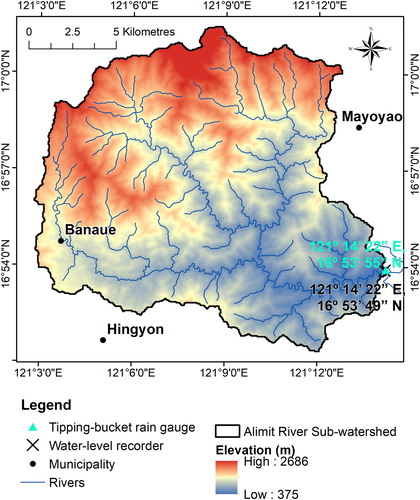
Figure 4. Input maps required by the model: (a) land use/ land cover map, (b) NDVI map, (c) Manning's n map, and (d) saturated hydraulic conductivity (Ksat) map.
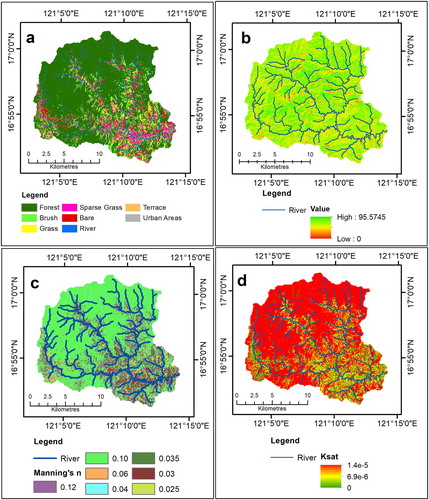
Table 1. Manning's n and saturated hydraulic conductivity value for various land uses.
Table 2. Spatial characteristics of raster data used in modelling.
Table 3. Land use categories and their area coverage for Alimit River Sub-watershed.
Table 4. Rainstorm events utilized in the modelling of soil erosion and runoff.
Figure 5. Correlation analysis between the measured and predicted streamflow.
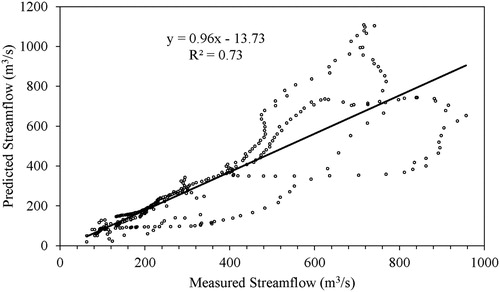
Figure 6. Correlation analysis of measured and predicted sediment mass.
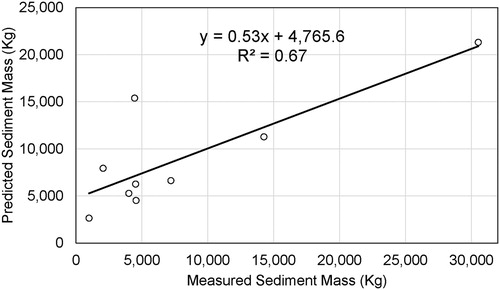
Figure 7. Sediment mass and predicted streamflow of Alimit River, October 18–19, 2015, Barangay Alimit, Mayoyao Municipality.
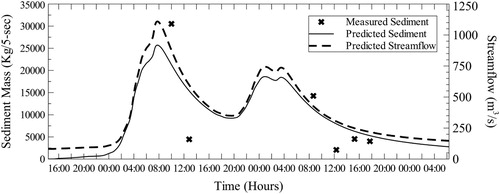
Table 5. Summary table of rainfall and estimated runoff and eroded sediments for Alimit River Sub-watershed.
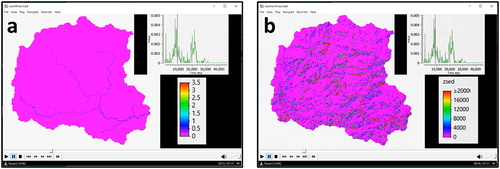
Figure 8. Screengrab of timeseries videos being played on a media player software: (a) Runoff timeseries video for rainstorm event 3 and (b) Sediment mass timeseries video for rainstorm event 3.