Figures & data
Figure 1. (a) Location of the study reach. See the main map for data information. (b) Representative stretches of the Orba River floodplain reach planform features. The gray dotted lines represent artificial levees. In (b1) the artificial-levee-delimited flood corridor (LFC), that is the floodplain comprised between the bank and the artificial levee, is indicated. The left LFC (1), the active channel (2), and the right LFC (3) are shown along the AA’ segment.
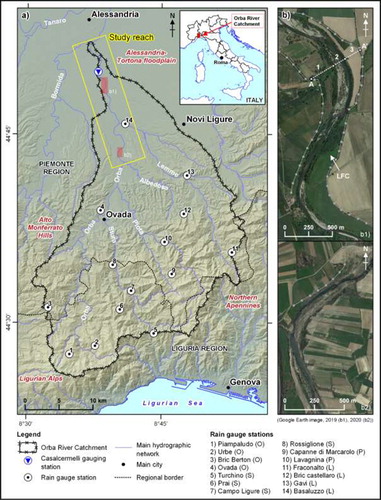
Table 1. Maximum water level and related discharge measured and estimated, respectively, at the Casalcermelli gauging station for the most recent high-magnitude floods (see for location).
Figure 2. (a) 21 October rainfall values measured by the Rossiglione and Gavi rain gauges (time is referred to CEST). They are the rain gauges that registered the maximum daily rainfall during the event (). (b) Hydrometric level recorded by the Casalcermelli gauging station (see for location; time is referred to CEST).
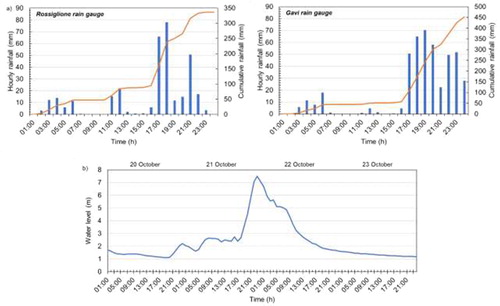
Table 2. Rainfall values measured within the Orba River catchment from 18 to 23 October 2019.
Figure 3. Percentage area of distinct LULC classes affected by the Orba River flood. Wc: water course, Ql: quarry lake, Nat: natural and semi-natural area, Agr: agricultural area, Cuf: continuous urban fabric, Duf: discontinuous urban fabric, Ind: industrial area, Qs: quarried sediment processing site, Q: quarry, R: road infrastructure
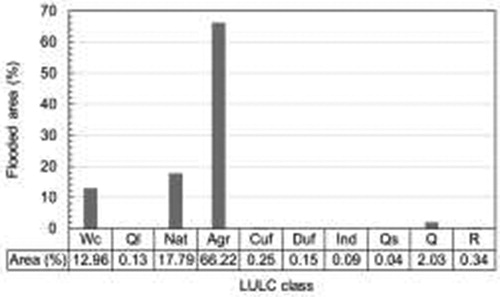
Figure 4. The Orba River active channel after the 21–22 October 2019 flood. (a) Bar affected by intense sediment mobilization and vegetation cover reduction. (b) Bank retreat process involving the modern floodplain. (c) Bank retreat process involving the recent terrace that was already ongoing before the flood. The white line represents a real height of 1.8 m. (d) Collapsed bank protection; most of these structures were already partly or totally collapsed before the flood.
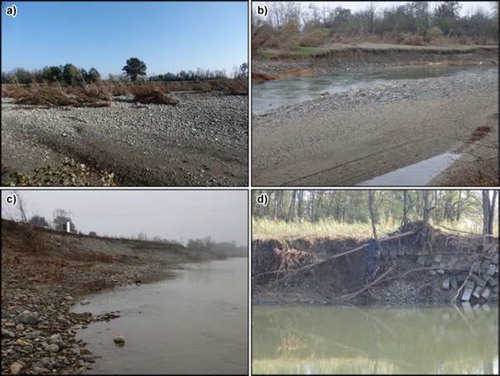
Figure 5. Effects of erosion and deposition processes over the floodplain. (a) Dusty road removed by the flood (white dotted line) and sediment lobes formed downstream. (b) Evidences (worked-soil removal and elongated scour hole formation) of intense superficial erosion that affected agricultural areas within the LFC. (c) Damage to the 179 Provincial Road embankment. (d) Damage to the road between Capriata and Bruno/Ospedale and elongated scour hole downstream of the road itself. These linear infrastructures (c, d) were overtopped and eroded. Downstream intense erosion and deposition processes occurred. It is noteworthy the draining-pipes-induced erosion downstream of the embankment (d). The white arrows (c, d) indicate the same point on the post-flood orthophotograph (PFO) (CitationADBDPO, 2019) and the field photograph (Pc, Pd); the yellow dot represents the location of photographs (Pc) and (Pd). The blue arrows indicate the main flood-water direction.
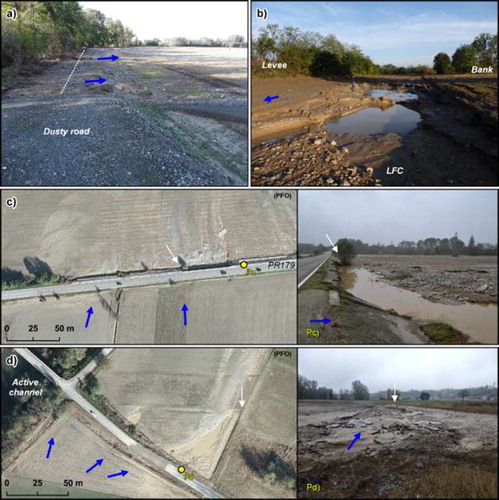
Figure 6. AGs formed or reactivated over the flooded area. (a) Example of AGs reactivated during the 21–22 October 2019 flood downstream of Garzaia, located outside (Pa1) and within (Pa2) the LFC. The white arrows a1 and a2 indicate the same point on the PFO (CitationADBDPO, 2019) and the field photograph (Pa1) and (Pa2), taken at the yellow dot. (b) AGs developed along steep anthropogenic scarps shaped by quarrying activity at Orbetta-Pitocca (b1) and Bruno (b2). (c) AG formation scheme. Newly-formed AG upstream of Garzaia (c1). The schematic not-to-scale cross section AA’ (c2), dashed line in (c1), highlights the AG (c1) formation scheme: the concentrated flood-water from floodplain entering the active channel (blue arrow) triggered a scarp regressive erosion process (dashed arrow) that resulted in the AG formation and enlargement by the AG headcut progressive retreat (series of dotted lines). Vertical arrows in (c1) and (c2) indicate the same scarps, respectively. (d) Continuous scarp front AG developed along a quarry scarp downstream of Pennaceto. In (d1) the eroded scarp is between two ancient quarries; the eroded scarp in (d2) is upstream of the (d1) site. The black dashed pattern indicates the anthropogenic depression (b, d); the blue arrows indicate the main flood-water direction.
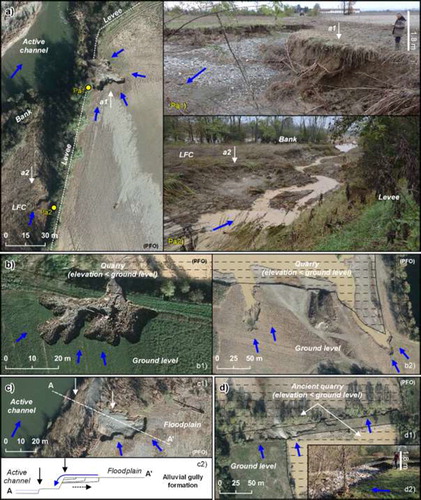
Figure 7. Damage to the levee system at Garzaia. (a) Structural damage to the levee embankment. (b) Levee breach and scour hole; the dotted line represents the levee cross section and the blue arrow indicate the main flood-water direction. The vertical white line represents a real height of 2.2 m.
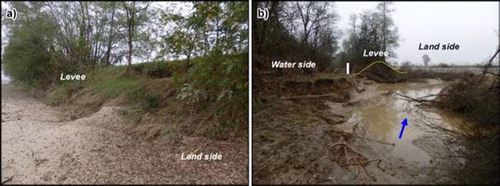
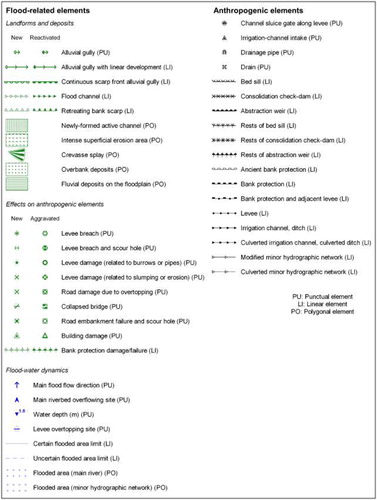
Figure 8. The newly-developed legend entries and related symbols aiming to map in detail the FREs after a high-magnitude flood and a number of anthropogenic elements, in a typical lowland agricultural landscape with regulated rivers.