Figures & data
Figure 1. Hierarchical levels and ‘full coverage’ concept.
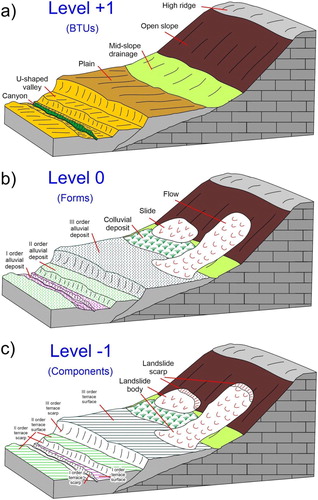
Figure 2. TPI (Topographic Position Index) semi-automatic landform classification. (a) TPI at three different scale: A is very small scale it is kind of plain area; B is moderate scale is kind of small hill and C is very large scale it is a kind of valley. (b) Slope Position Classification. CitationWeiss (2001) demonstrates one possible classification process using both TPI and slope to generate a 6-category Slope Position grid. (c) Landform Classification can be determined using 2 TPI grids at different scales.
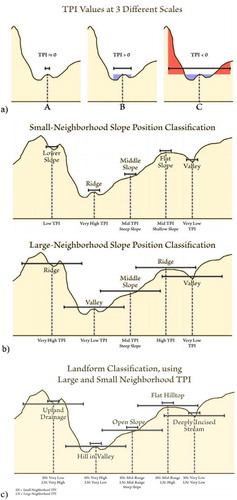
Figure 3. Schematic geological map of the Marche region. (1) – Main continental deposits (Pliocene-Pleistocene-Holocene); (2) – sands and conglomerates (Pliocene-Pleistocene); (3) – clays and sands (Pliocene-Pleistocene); (4) – arenaceous-marly clayey turbidites (late Miocene); (5) – limestones, marly limestones and marls (early Jurassic-Oligocene). Red star indicates the location of the study area.
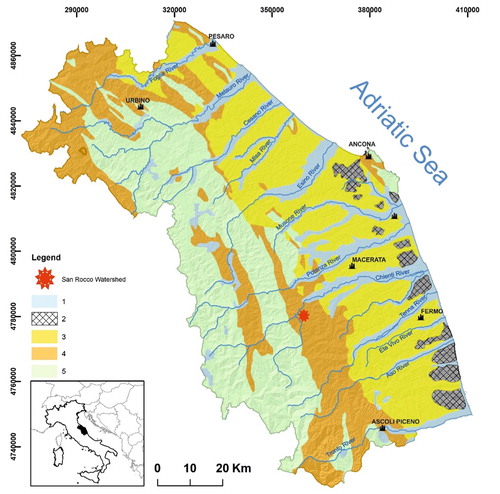
Figure 4. Example (not in scale) of ‘Levels’ of representation; (a) a Form’ landslide visible at 1: 10000 scale (Level 0); (b) another landslide subdivided in its ‘Components’ body and scarp visible at 1:1000 scale (Level – 1).
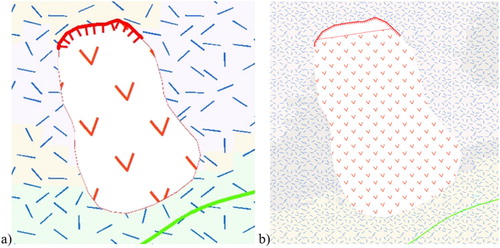
Figure 5. Example of attribute table. A (Activity): Active; Acronym: code that is given to each geomorphological typology; Hol – A: from Holocene to Actual.
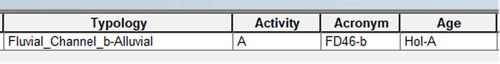
Figure 6. Example of Selective erosion scarp. (1) lithotypes consisting of alternations (arenaceous-pelitic or pelitic-arenaceous); (2) mainly arenaceous lithotypes; (3) mainly clayey lithotypes; (4a) Selective erosion scarp (Polyline); (4b) Selective erosion scarp (Polygon).
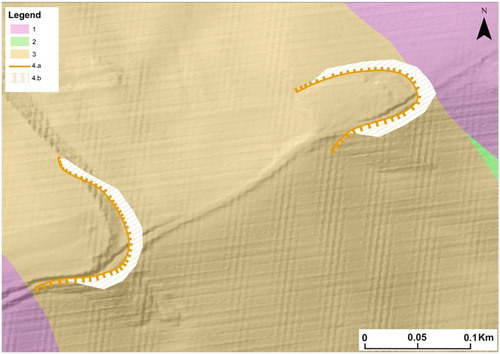
Figure 7. (a) ‘Full Coverage’ Geological Map. FCOc: Argille a Colombacci formation, arenaceous member; FCOd: Argille a Colombacci formation, arenaceous-pelitic member; FCOe: Argille a Colombacci formation, pelitic-arenaceous member; GS: Gessoso-solfifera member, GSa: clastic facies; LAG3c: Laga formation, arenaceous member; LAG3d: Laga formation, arenaceous- pelitic member; LAG3e: Laga formation, pelitic- arenaceous member; SCH: Schlier formation; a: volcano-clastic guide-level; (b) Lithotechnical Map. (1) lithotypes consisting of alternations (arenaceous-pelitic or pelitic-arenaceous); (2) mainly arenaceous lithotypes; (3) mainly clayey lithotypes.
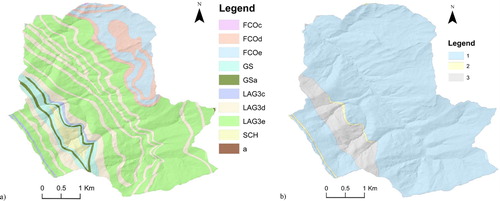
Figure 8. Relationships between neighborhood intervals and DTM cell-size.
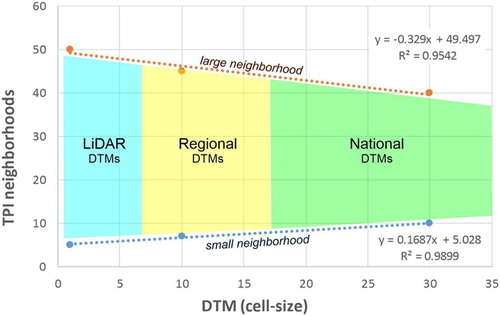
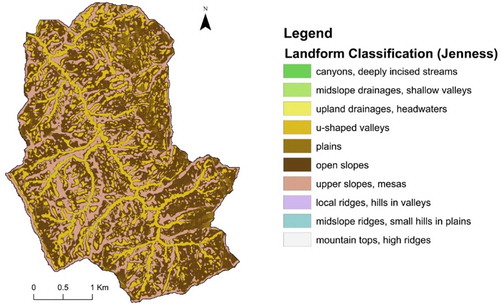
Figure 9. Landform Classification Map. (a) SRTM (small neighborhood = 10 m; large neighborhood = 40 m); (b)TINITALY (small neighborhood = 7 m; large neighborhood = 45 m); (c) LiDAR (small neighborhood = 5 m; large neighborhood = 50 m); In black the Study Area.
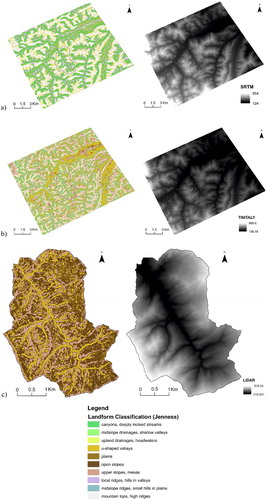
Figure 10. The BTUs Map for San Rocco Stream Basin.