
Figures & data
Figure 1. Location sketch of the study area. The dashed blue rectangle (A) refers to the position of , whereas the yellow one (B) refers to the position of .
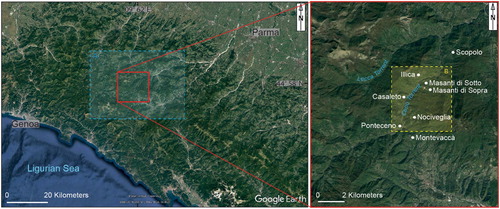
Table 1. Historical texts and maps sources collected for the Casaleto-Illica landslide.
Figure 2. Steps followed for establishing the historical map accuracy, by comparing two maps depicting the same area. The image distortion due to the camera or the scanner is eliminated by putting orthogonal rulers on the maps in step (A) and then applying an orthorectification of the image adapting them to a predisposed mm-sized grid in (B). The two maps are then overlapped considering the homologous points (symbols ‘.’ and ‘,’) and applying translation, scaling and rotation transformations (C). A common area identified on both maps is clipped (D) and then the two sub-maps are separately georeferenced using the same GCPs (E; symbol ‘X’) and applying rigid transformations only, finally obtaining the possibility to evaluate the accuracy of the two historical maps.
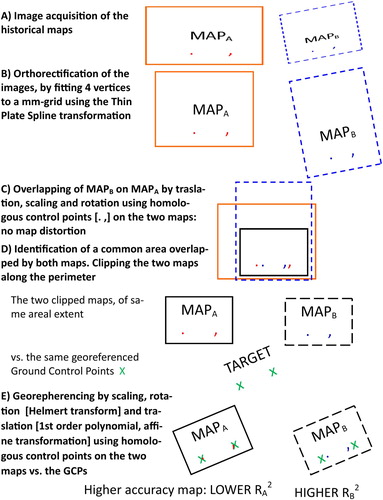
Figure 3. Pictures of the map (1:500,000) by CitationAlmagià (Citation1907) documenting landslides (red irregular polygons in the map) affecting the study area.
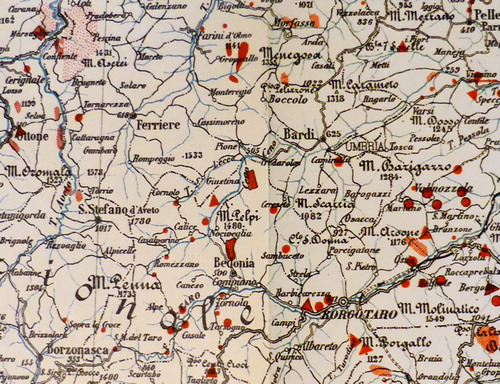
Figure 4. The Mt. Bello slope with the Illica landslide in AD 1907 (top picture, taken by R. Almagià) and in September 2020 (bottom picture, taken by G. Leonelli). Both pictures are taken from the right side of the Ceno Valley, in the vicinities of the Masanti di Sopra town, in the WNW direction.
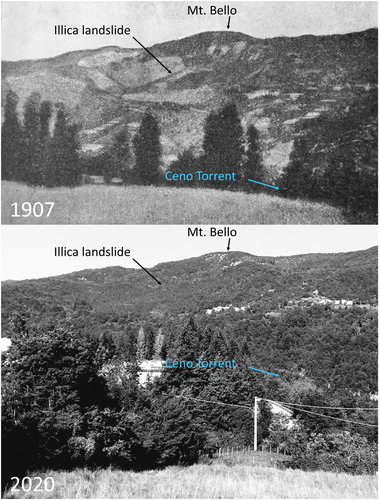
Figure 5. Detail of the landslide-dammed Lake of Casaleto reported in the Gozzi’s map 28/09 (the one not included in the geo-historical map): Topografico stato di Parma e di Piacenza; ASPr, Raccolta di mappe e disegni, vol. 28/09.
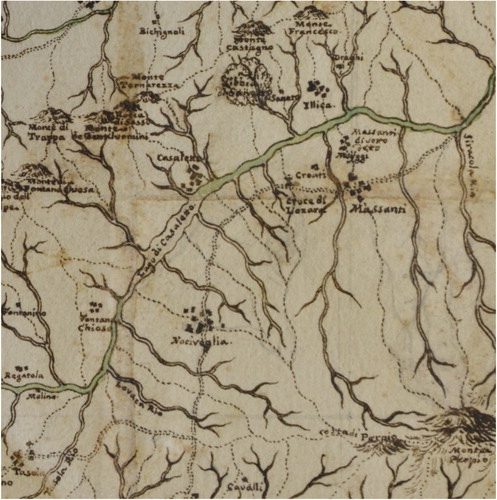
Table 2. Mean squared error values obtained for the two overlapping maps’ areas (6.5 × 7 km) opportunely predisposed and georeferenced on the same GCPs using only rigid transformations including scaling, rotation (Helmert transformation) and translation (1st –order polynomial). Map coded 27/28 showed the lowest R2 values for both applied transformation algorithms, indicating a higher accuracy than the other map.