
Figures & data
Figure 1. The previous phosphorus map was produced in the GIS laboratory of the Hungarian Academy of Sciences. (CitationCsermák & Máté, Citation2004).
The figure presents an old map that was created by using the Thyssen polygon interpolation technique, it cannot reflect the spatially continuous nature of the phosphorus concentration of bed sediments.
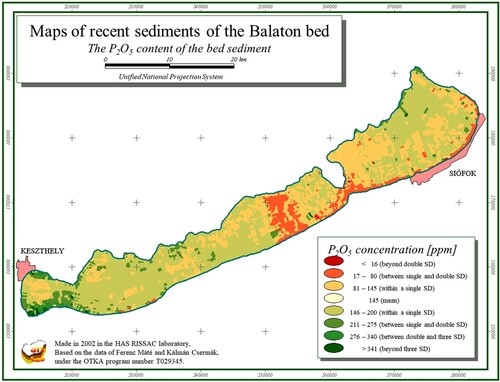
Figure 2. Scatter plot of the observed and estimated phosphorus content (mg/kg) of the lake sediment.
The figure shows the result of the validation, values of the test data and the estimated data are demonstrated on the plot, a strong correlation can be observed between measured and estimated phosphorus content.
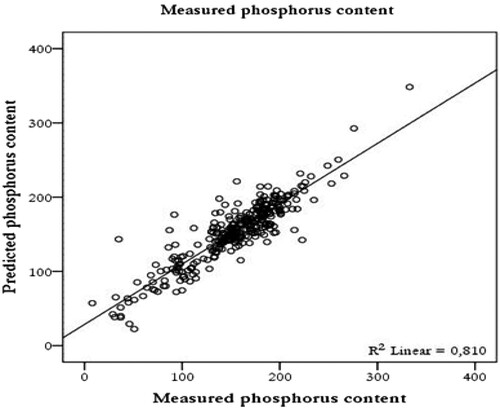
Table 1. Characteristics of Lake Balaton sediment mapping.
Table 2. Auxiliary variables used in modelling and mapping phosphorus content
Table 3. Summary of PCA in the order of decreasing explained variance
Table 4. Model summary
Supplemental material
Supplemental Material
Download PDF (44.1 MB)Data availability statement
The data supporting the findings of this study are not public but are available from the Hungarian Academy of Science (www.mta.hu).