
Figures & data
Figure 1. (a) Location of the study area in southern South America. Former limit of the Patagonian Ice Sheet according to CitationDavies et al. (Citation2020) is outlined as a white polygon. Present Patagonian Ice Fields are depicted in grey. (b) Overview of the Chilean Lake District and the Chilotan archipelago showing the coverage of used aerial photographs (dark blue dots: centroids of GEOTEC images) and satellite imagery (light green boxes: Sentinel 1 imagery; blue light boxes: ALOS PALSAR digital elevation model). Field-checking areas (solid red line: inspected on the ground; dashed red line: helicopter inspection). (c) Digital elevation model of Isla Grande de Chiloé region highlighting the main sites of the study area.
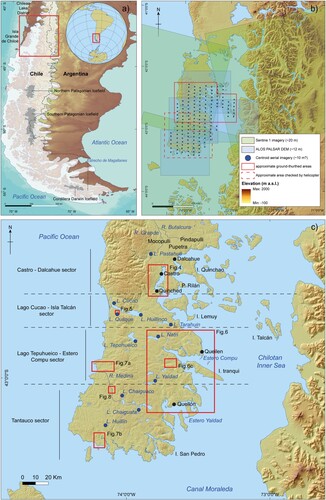
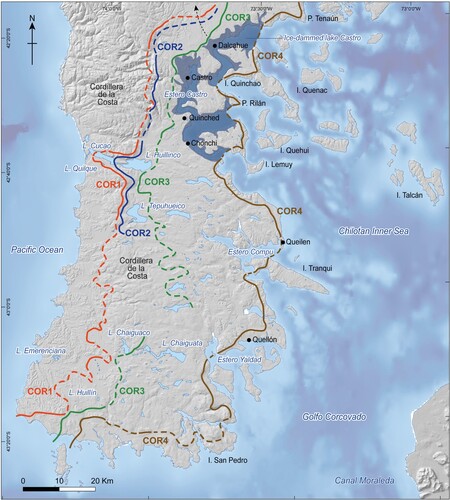
Figure 2. ALOS PALSAR digital elevation model presenting the approximate extent of the major glacial limits in the Chilean Lake District and Isla Grande de Chiloé according to CitationAndersen et al. (Citation1999) and CitationGarcía (Citation2012). The GEBCO 2019 bathymetry of the Chilotan Inner Sea is also shown. Most constraining radiocarbon ages (CitationDenton et al., Citation1999; CitationGarcía, Citation2012; CitationMoreno et al., Citation2015) and recent Bayesian-modelled age based on composite 14C, 10Be and infrared stimulated luminescence (CitationGarcía et al., Citation2021) of the Golfo Corovado ice lobe activity. Green dots indicate close maximum-limiting 14C ages for glacial advances. Yellow dots represent close minimum-limiting 14C for glacial advances. Dark blue dot points the deposition age of the upper Lago Cucao outwash terrace. Radiocarbon ages have been recalculated using the calibration curve from CitationHogg et al. (Citation2020). From north to south, black dashed arrows indicate the inferred ice flow of the Lago Llanquihue, Seno Reloncaví, Golfo Ancud and Golfo Corcovado ice lobes.
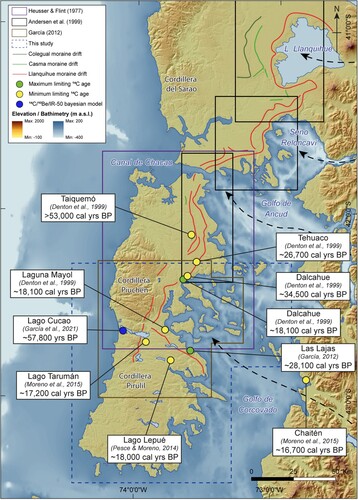
Table 1. Stratigraphic names of the glacial drift hosted in the Chilean Lake District and Isla Grande de Chiloé according to CitationMercer (Citation1972, Citation1976), CitationHeusser and Flint (Citation1977), CitationPorter (Citation1981) and CitationDenton et al. (Citation1999) Golfo Corcovado ice lobe drift sequence labeled by CitationMercer (Citation1972, Citation1976) and CitationDenton et al. (Citation1999).
Figure 3. Schematic map showing main oceanographic and tectonic features in the study area. Offshore, the South Pacific current splits into the Humboldt current to the north and the Cape Horn current to the south broadly at the latitude of the Chilotan Archipelago (CitationStrub et al., Citation2019). In the continent, the location of some of the volcanoes and larger caldera systems in the Southern Volcanic Zone (∼33–46°S) of South America (modified from CitationStern et al., Citation2007). The grey shaded line indicates the eastern limit of the Cenozoic arc volcanism, while the dashed north-south line labeled LOFZ is the Liquiñe-Ofqui Fault Zone (CitationCembrano et al., Citation1996, Citation2000). Hypocenters of main earthquakes since 1950, and their spatial classification with respect to the Chile-Perú Trench, are also indicated (CitationRuiz & Madariaga, Citation2018).
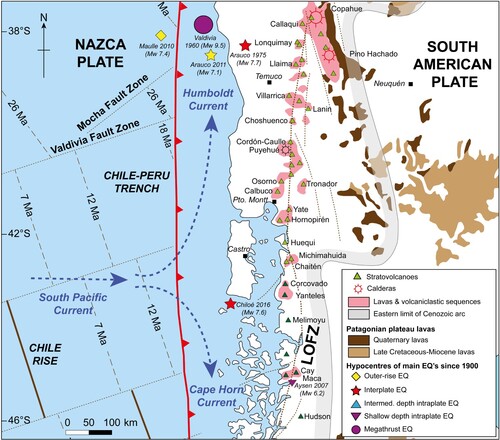
Table 2. Summary of glacial landforms, identification criteria, uncertainties, and previous mapping of the geomorphology of the Golfo Corcovado ice lobe (adapted from CitationBendle et al., Citation2017; CitationDarvill et al., Citation2014; CitationLeger et al., Citation2020; CitationLovell et al., Citation2012; CitationSoteres et al., Citation2020).
Figure 4. Oblique aerial photographs of the morainal topography and moraine ridge near Castro ((c)).
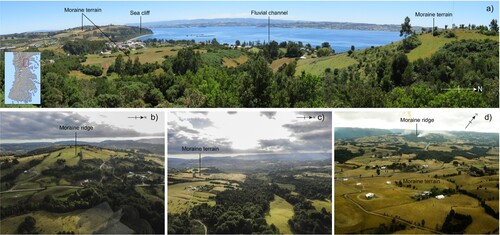
Figure 5. (a) Overview of the sequence of outwash plains nearby Lago Cucao and ice-contact slope of Lago Quilque ((c)). (b) Detail of a stratigraphic exposure at the culmination of the Lago Quilque ice-contact slope.
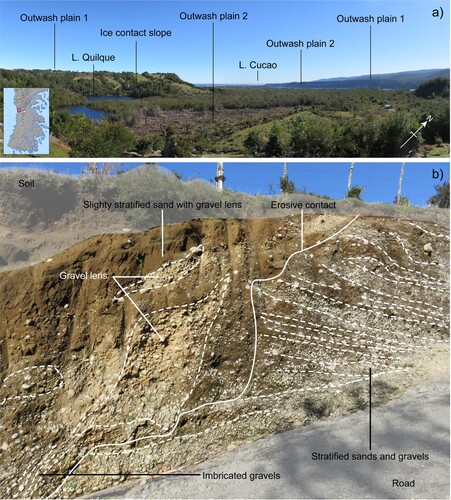
Figure 6. (a) ALOS PALSAR digital elevation model of the subglacial channels located in the eastern shore of Isla Grande de Chiloé between Queilen and Quellón ((c)). (b) Geomorphic map of the area illustrating the extent of major subglacial channels. (c) Oblique aerial overview of a subglacial channel. The location and direction are indicated by a red circle with lines in 6b.
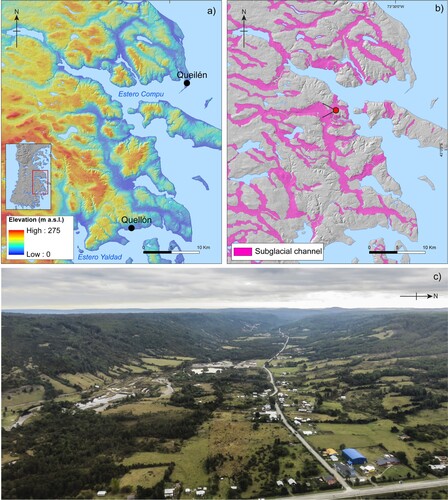
Figure 7. (a) Oblique aerial overview of the outwash constrained by the Cordillera de la Costa topography in the Tantauco area ((c)). (b) Oblique aerial overview of the southern coastline of Tantauco ((c)).
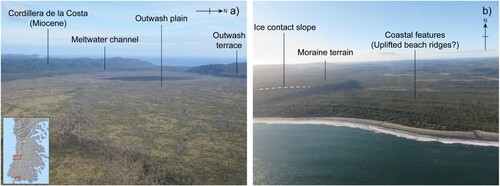
Figure 8. (a) Slope map derived from the ALOS PALSAR digital elevation model of the ice-contact slope located in the Río Medina valley of the Tantauco sector ((c)). (b) Geomorphic map illustrating the distribution of main ice marginal features of a portion of the Río Medina valley and considered as the outermost position of the Golfo Corcovado ice lobe in the Tantauco sector. (c) Oblique aerial overview of the ice-contact slope located in the Río Media basin in the Tantauco sector.
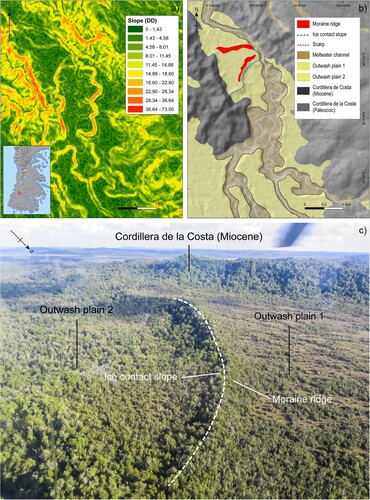
Figure 9. Extent of the Golfo Corcovado ice lobe inferred from our geomorphic map. Solid lines represent ice-front position reflected by the geomorphic record. Dashed lines represent inferred ice-front positions due to the fragmentary nature of the geomorphic record. Semitransparent dark blue polygon indicates the inferred extent of the proglacial Lake Castro and black dashed arrow the potential drainage path during its early stages.
TJOM_2008538_Supplementary Material
Download PDF (35.4 MB)Data availability statement
ESRI shapefiles (*.shp) for visualizing the map produced in this study are freely available, as long as original publication is properly cited. A folder with twenty-four shapefiles can be downloaded from a Mendeley Data online repository using the following doi:10.17632/hzg2tvvxk8.1.