
Figures & data
Figure 1. Map of the Portland metropolitan region with major rivers and streams.
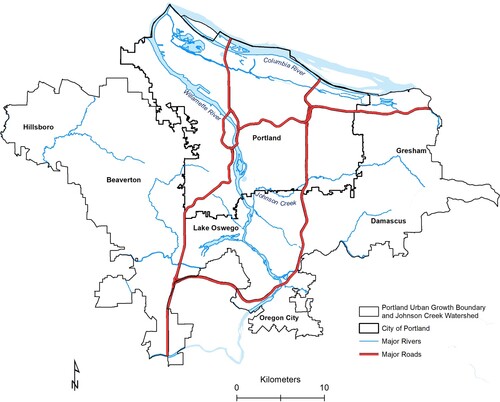
Table 1. Sources and descriptions of maps.
Figure 2. Map of disappeared streams symbolized by the oldest house construction date in the proximity of the former stream locations.

Figure 3. Map of disappeared streams symbolized by the average house construction date in the proximity of the former stream locations.
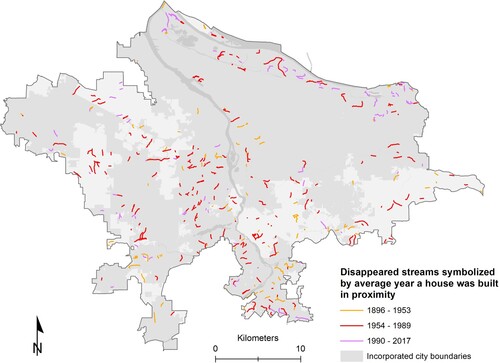
Figure 4. A high-resolution aerial photo showing examples of houses that were built in the proximity of a disappeared stream in the City of Portland, Oregon.
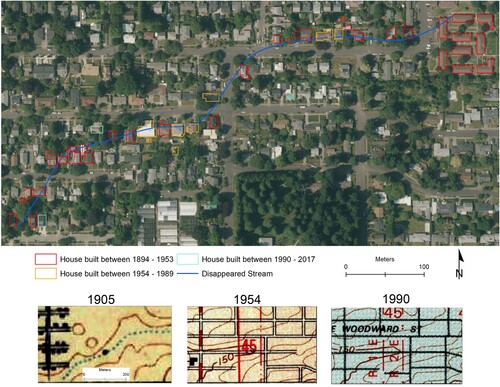
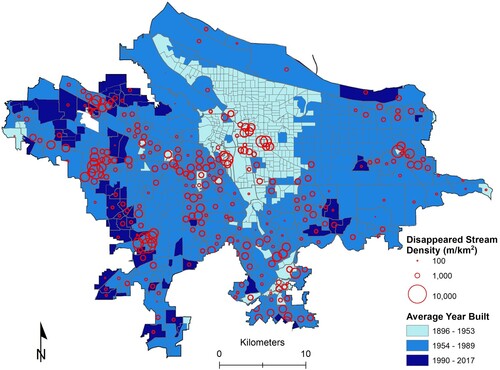
Figure 5. Density of streams per census block group (m of stream/km2).
TJOM_A_2035264_Supplementarymaterial
Download PDF (119.6 MB)Data Availability Statement
The USGS topographic maps are available at https://ngmdb.usgs.gov/topoview/.
Regional Land Information System (RLIS) stream routes layer and parcel layer are available at the Oregon Metropolitan RLIS Discovery system https://gis.oregonmetro.gov/. The digitized disappeared stream GIS data that support the findings of this study are available at https://github.com/greggreg1/PDX_Disappeared_Streams.