
Figures & data
Figure 1. City region geography
A map of the United Kingdom showing the aggregation of local authority districts to city region geographies.
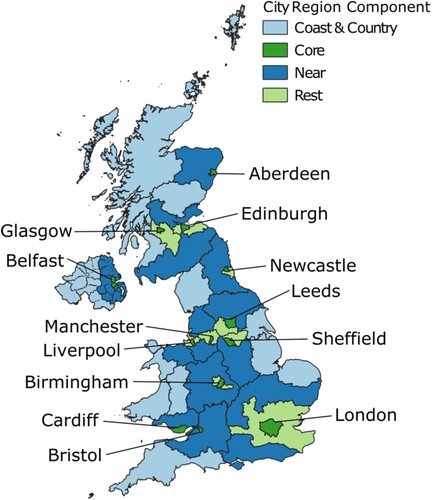
Figure 2. Migration rates for each city region component.
Four maps of the United Kingdom, showing the migration rate for each city region component part in 1981, 1991, 2001 and 2011.
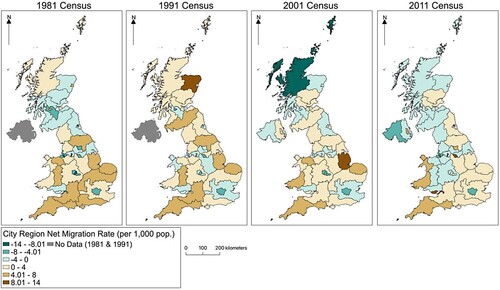
Figure 3. Migration efficiency ratios at LAD scale.
Four maps of the United Kingdom, showing the migration efficiency of each local authority district in 1981, 1991, 2001 and 2011.
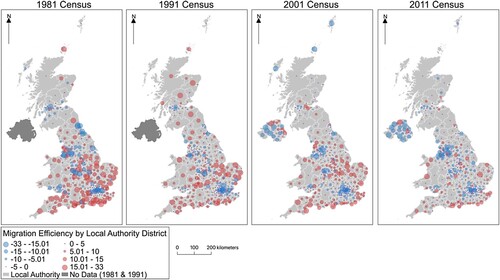
Table 1. A summary of migration efficiency values across all LADs.
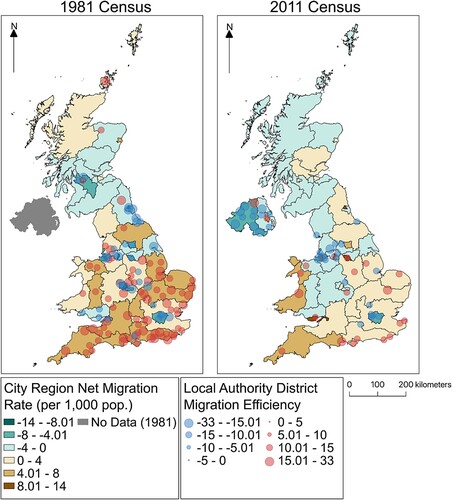
Figure 4. Identifying the most efficient local authority districts within the city region context, 1981 and 2011.
Two maps of the United Kingdom, showing local authority district migration efficiency overlaid atop City Region migration rates in 1981 and 2011.
Supplemental material
Main Map
Download PDF (29 MB)Data availability statement
All census data for were downloaded from the Web-based Interface to Census Interaction Data (WICID) platform supported and maintained by the UK Data Service Census Support (https://wicid.ukdataservice.ac.uk/). The data used are freely available for download from this source.