
Figures & data
Figure 1. The spatiotemporal dimension of population change in Ireland: Visualisation of growth and shrinkage in Irish Electoral Divisions (1986–2016).
A map of Ireland showing population changes in intercensual periods and from 1986 to 2016. The main map – which focuses on the overall period – also includes inset maps into Ireland’s five main cities. Population loss is predominately experienced in the west and midlands of Ireland. Areas near main cities tend to experience population increases. Inset maps show, however, some EDs within cities have also experienced population decreases.
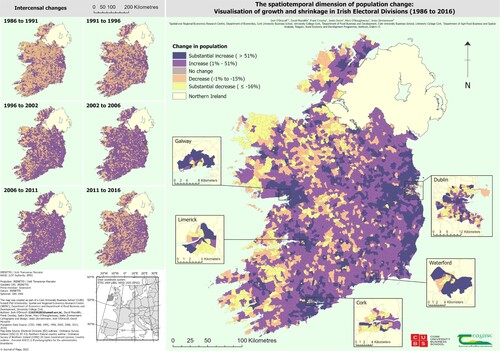
Table 1. Components of population change – change in population since previous census (1986–2016).
Table 2. Components of population change – estimated net migration (1986–2016).
Supplemental material
Supplemental Material
Download Zip (2.8 MB)Data availability statement
Raw Census of Population data is available from Central Statistics Office (CSO) and Irish Social Science Data Archive (ISSDA). Rectified dataset is part of funded PhD and not yet available to share.