
Figures & data
Figure 1. Map of the study area.
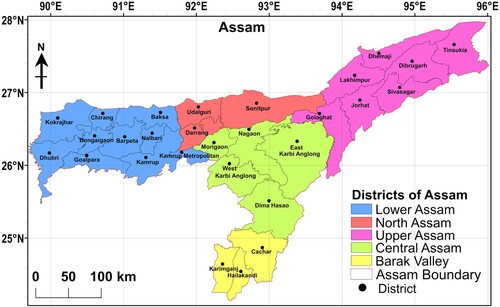
Figure 2. Methodology for the estimation of surface runoff.
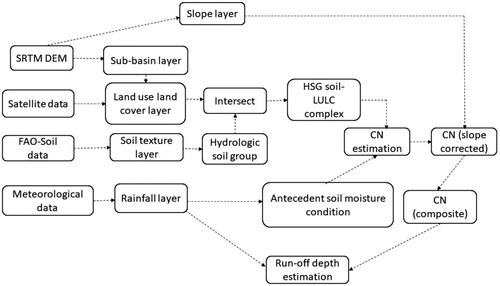
Figure 3. (a) Sub-basin with stream network, (b) Land use and land cover, (c) Surface slope, and (d) Hydrologic soil group.
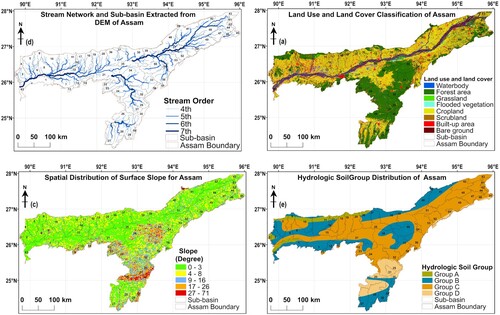
Table 1. Accuracy assessment of LULC map.
Figure 4. Spatial distribution of (a) Curve number I, (b) Curve number II, (c) Curve number III, (d) Slope-corrected curve number I, (e) Slope-corrected curve number II, and (f) Slope-corrected curve number III.
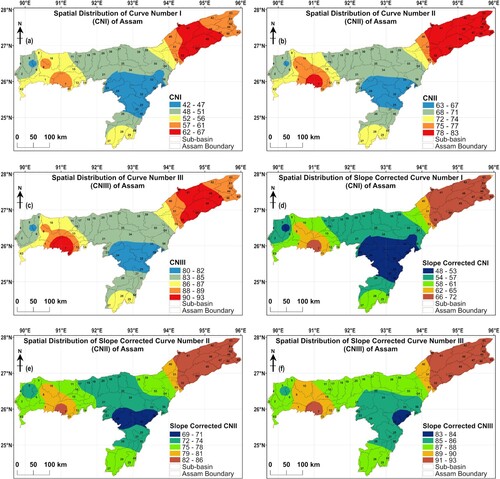
Table 2. Estimation of curve number for each LULC-HSG complex of the study area.
Figure 5. (a) Mean annual precipitation and (b) Surface runoff depth.
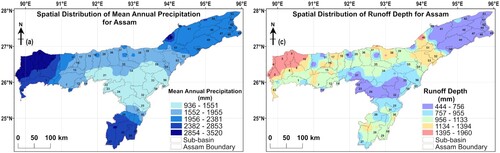
Figure 6. Correlation between rainfall and simulated runoff depth.
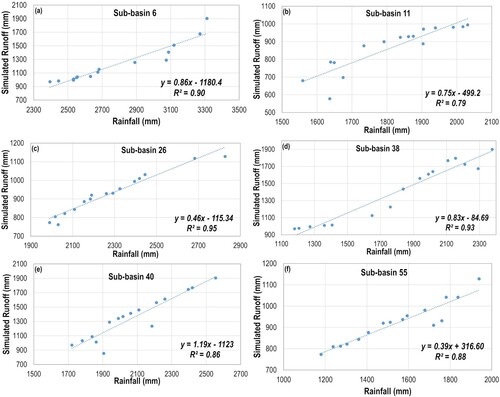
Figure 7. Correlation between simulated and measured runoff depth.
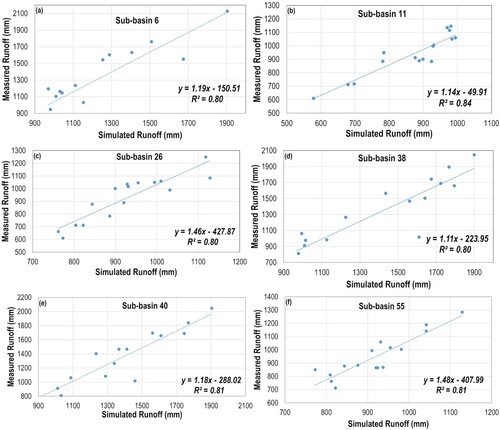
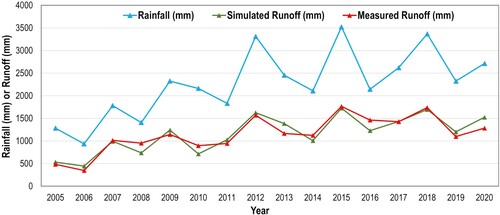
Figure 8. Temporal variation of rainfall, simulated and measured runoff depth.
TJOM_A_2076624_Supplementarymaterial
Download PDF (1.5 MB)Data Availability Statement
The authors confirm that the data supporting the findings of this study are available within the article and some of the raw data were generated at our laboratory and derived data supporting the findings of this study are available upon reasonable request.