
Figures & data
Figure 1. Dissemination of rural accommodation (Kernel density estimated from the year of opening).
Map of mainland Portugal with dots representing rural tourism units by age, and colored patches indicating the urbanization character (degree) of an area: water, mostly uninhabited, dispersed rural areas, villages, suburbs, semi-dense towns, dense towns, and urban centers.
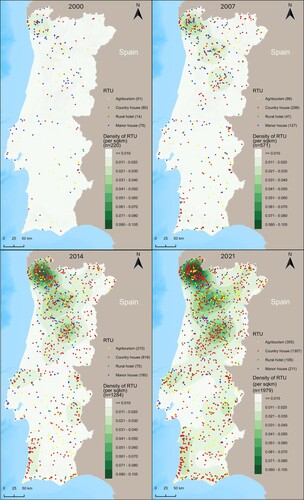
Table 1. Average DEGURBA according to typology and time of opening.
Figure 2. The wine regions and Natura 2000 areas most relevant to Kernel density of accommodation units.
A four-section figure with maps of mainland Portugal, featuring the dissemination and density of rural tourism units in 2000 (upper left), 2007 (upper right), 2014 (lower left), and 2021 (lower right). Each map features dots and a kernel density surface, as the backdrop, representing rural tourism units.
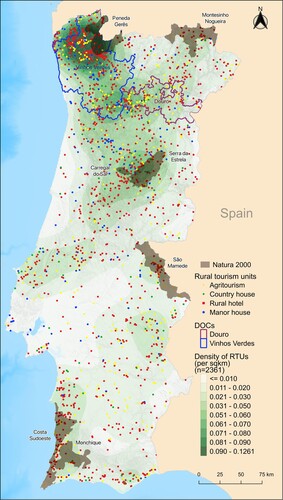
Table 2. Average distance (m) from vineyards, according to the wine region and typology of establishment.
Table 3. Average distance (m) from NATURA 2000, according to the typology of establishment.
Supplemental material
TJOM_A_2079430_Supplementary material_Map2
Download PDF (47.5 MB)TJOM_A_2079430_Supplementary material_Map1
Download PDF (47.1 MB)Data availability statement
The data sets that support the findings of this study are all publicly available and referenced and can be provided by the corresponding author, RB, upon reasonable request.