
Figures & data
Figure 1. Data centers in Amsterdam. A map of the city of Amsterdam with 67 opaque circles plotted over the underlying city. Each circle corresponds to the location of an Amsterdam data center. Red opaque circles vary in size to reflect the kilowattage capacity of the data center in that location. Their radii are based on the following formula: (0.1 m)*(kW Consumption Capacity). Amsterdam has several large circles, some representing excess of 50,000 kW, the equivalent of over. Black opaque circles represent data centers whose kW capacities were not reported and could not be found. Amsterdam has approximately as many black circles as red.
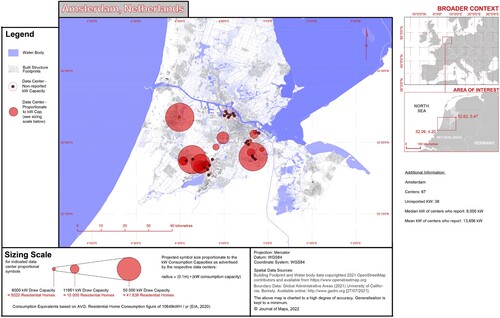
Figure 2. Data centers in Luxembourg. A map of Luxembourg with 13 opaque circles plotted over the underlying country. Each circle corresponds to the location of a Luxembourg data center. Red opaque circles vary in size to reflect the kilowattage capacity of the data center in that location. Their radii are based on the following formula: (0.1 m)*(kW Consumption Capacity). Luxembourg’s data centers have small to medium sized radii, usually boasting a capacity below or near 10,000 kW, the equivalent of less than 10,000 residential homes based on 2020 figures from the EIA. Black opaque circles represent data centers whose kW capacities were not reported and could not be.
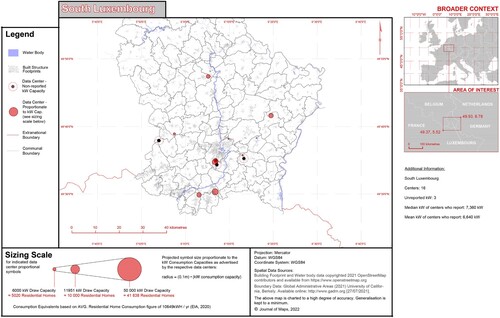
Figure 3. Data centers in Seattle. A map of Seattle with 46 opaque circles plotted over the underlying country. Each circle corresponds to the location of a Seattle data center. Red opaque circles vary in size to reflect the kilowattage capacity of the data center in that location. Their radii are based on the following formula: (0.1 m)*(kW Consumption Capacity). Seattle’s data centers have a diverse range of radii, some boasting capacities near 50,000 kW, the equivalence of 40,000 residential homes based on 2020 figures from the EIA. Black opaque circles represent data centers whose kW capacities were not reported and could not be found. Seattle’s map features very few black circles.
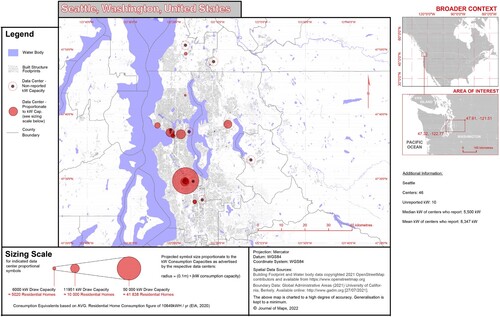
Figure 4. Data centers in Quincy. A map of Quincy, Washington with 11 opaque circles plotted over the underlying country. Each circle corresponds to the location of a data center. Red opaque circles vary in size to reflect the kilowattage capacity of the data center in that location. Their radii are based on the following formula: (0.1 m)*(kW Consumption Capacity). Quincy’s data centers have a diverse range of radii, some boasting capacities as high as 100,000 kW, the equivalence of 80,000 residential homes based on 2020 figures from the EIA. Per the USA Census Bureau, Quincy Washington in 2019 had a population of nearly 8,000 people. Black opaque circles represent data centers whose kW capacities were not reported and could not be found. Quincy’s data sheet only had one center with an unreported kW capacity.
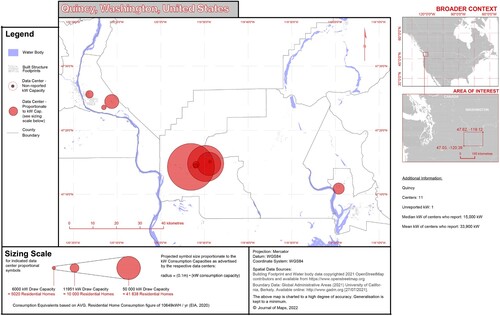
Table 1. Overview of the largest data centers found in the Amsterdam and Seattle areas.a
Supplemental Material
Download Zip (48.6 MB)Data availability statement
Data were derived from baxtel.com, datacenters.com and datacenterhawk.com which provide data in the public domain. Neither fee nor a registration is required to access this data.