
Figures & data
Figure 1. Location of Vetto on the Northern Apennines (Reggio Emilia province, Italy).
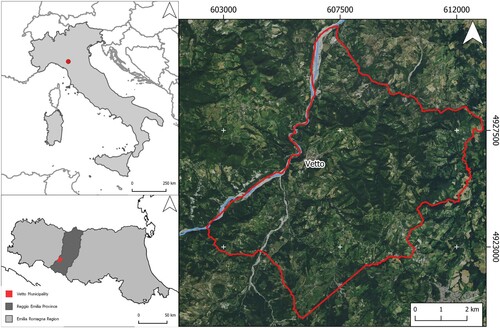
Figure 2. Remnants of historical agroforestry systems that are still recognisable in the Vetto area. Regular rows of service trees were used to be cultivated with vineyards and crops (Photo: Ⓒ Brandolini F. 2021).
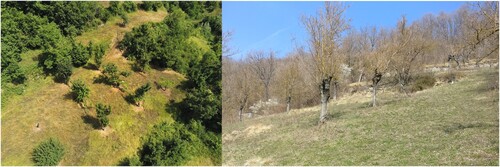
Figure 3. Schematic representation of the ‘uniform diachronic unit’ principle used for Historic Landscape Characterisation (modified from CitationDabaut & Carrer, Citation2020).
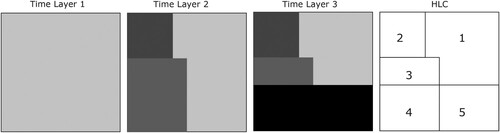
Table 1. Details of the sources employed for the HLC mapping in the study area.
Table 2. HLC Types defined in the research area.
Figure 4. Pie charts representing the occurrence of HLC Types in the four different periods: 1950s, 1970s, 2000s, 2010s.
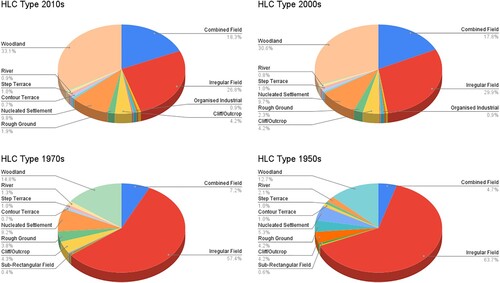
Figure 5. HLC maps representing the UDUs according to their chronology (on the left) and the most common HLC type in the current landscape (on the right).
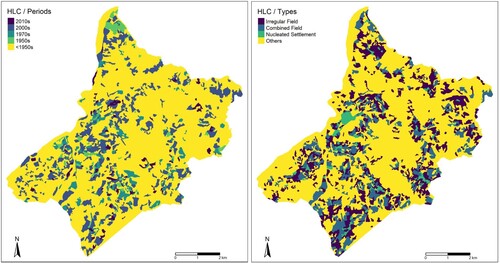
Figure 6. Results of the LICD analysis applied to the HLC chronology.
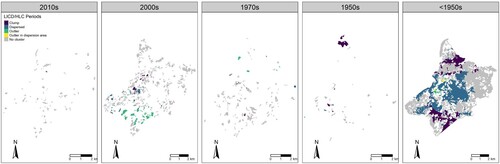
Figure 7. Results of the LICD analysis applied to the HLC types.
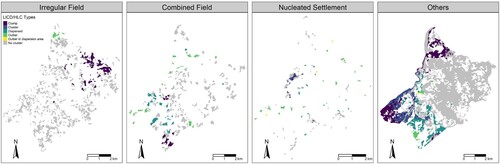
Table 3. Results of PPA with the historic settlement point pattern.
Table 4. Results of PPA with the abandoned rural buildings point pattern.
TJOM_2088305_Supplemental materials
Download PDF (38.2 MB)Data availability statement
The R script Code, HLC dataset and PPA spatial covariates are available on Zenodo: https://doi.org/10.5281/zenodo.5907229. For a detailed description of LICD, please refer to CitationCarrer et al. (Citation2021) while for an exhaustive explanation of the use of PPA in landscape archaeology, consider the paper of CitationKnitter and Nakoinz (Citation2018).