
Figures & data
Table 1. Descriptive summary for health and physical environment variables by state.
Table 2. Local GWR regression results for Food Insecurity.
Figure 1. GWR Estimates for No Vehicles.
GWR Estimates for Variables with Local Variation shows four maps (no vehicles) which depict variability in estimates across the study area.
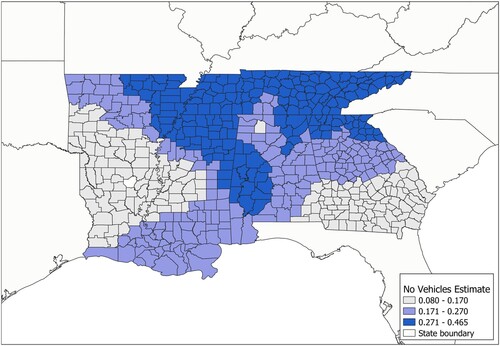
Figure 2. GWR Estimates for Severe Housing Cost Burden.
GWR Estimates for Variables with Local Variation shows four maps (severe housing cost burden) which depict variability in estimates across the study area.
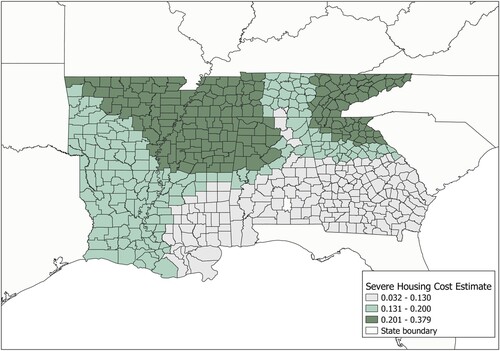
Figure 3. GWR Estimates for Mobile Homes.
GWR Estimates for Variables with Local Variation shows four maps (mobile homes) which depict variability in estimates across the study area.
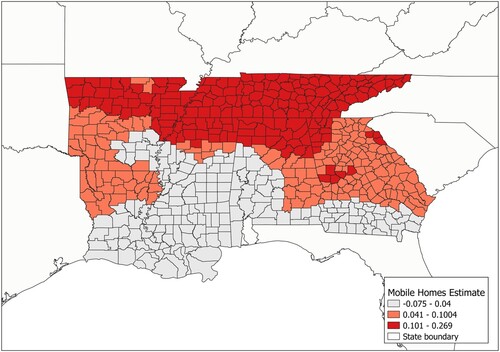
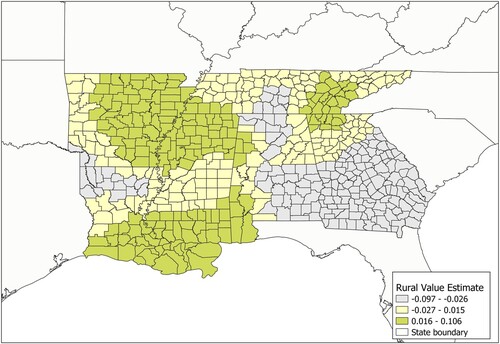
Figure 4. GWR Estimates for Rural Value.
GWR Estimates for Variables with Local Variation shows four maps (rural value) which depict variability in estimates across the study area.
Supplemental material
TJOM_A_2092909_Supplementary material
Download PDF (17.7 MB)Data availability statement
The author will provide data for any reasonable request.